ZedGraph使用筆記
ZedGraph小弟使用後,來寫一些小心得&備忘 順便測試一下"Windows Live Writer"
不然過一陣子忘記了,可是會"槌心肝"
廢話不多說啦
先引用他
Imports ZedGraph使用折線圖
Dim myCurve As LineItem'宣告一個折線圖
Dim Zg1 As New ZedGraphControl'宣告一個 ZedGraph

Zg1.Dock = DockStyle.Fill '我要他填滿畫面
'設定一下字型
Zg1.Font = New Font("Arial", 10, FontStyle.Underline)
Dim myPane As GraphPane = Zg1.GraphPane

myPane.Chart.Fill.IsVisible = False

'使用自己定義的底圖==========
Dim Image As Image = Nothing
Dim TexBrush As TextureBrush = Nothing

Image = My.Resources.Res1.Right_Dn_Page5
TexBrush = New TextureBrush(Image)

myPane.Fill = New Fill(TexBrush)
'============================
'宣告一個XDate的Date
Dim DT1 As XDate

        myPane.Title.Text = TitleName
        myPane.Title.FontSpec.Size = 10.0F

        myPane.XAxis.Title.FontSpec.Size = 10.0F
        myPane.XAxis.Scale.FontSpec.Size = 9.0F

        myPane.X2Axis.Title.FontSpec.Size = 10.0F
        myPane.X2Axis.Scale.FontSpec.Size = 9.0F

        myPane.YAxis.Title.Text = YName
        myPane.YAxis.Title.FontSpec.Size = 10.0F
        myPane.YAxis.Scale.FontSpec.Size = 9.0F

        myPane.XAxis.Scale.MinAuto = False
        myPane.XAxis.Scale.MaxAuto = False
        'myPane.X2Axis.Scale.MinAuto = False
        'myPane.X2Axis.Scale.MaxAuto = False

        '定義一下X軸的樣式
        myPane.XAxis.Type = AxisType.Date
        myPane.X2Axis.Type = AxisType.Date
        myPane.XAxis.CrossAuto = True

        myPane.XAxis.Title.Text = "Time (Hour)"
        '設定X軸FORMAT
        myPane.XAxis.Scale.Format = "HH:mm"


        Dim ShowList(1)'我要畫兩條線
        ShowList(0) = New PointPairList()
        ...
        '擺上時間,跟資料
        for ......
        ShowList(0).add(DateTime, Value)
        ShowList(1).add(DateTime, Value)
        next
       '把PointPairList塞進myCurve 裡面
        myCurve = myPane.AddCurve("", ShowList(0), Color.FromArgb(255, 88, 204, 13), SymbolType.None)
        '這裡是線條要不要平滑
        myCurve.Line.IsSmooth = False
        myCurve.Line.Width = 3.0F

        Zg1.AxisChange() '將資料填入元件中
Zg1.IsShowPointValues = True '顯示節點資料不過很醜吧
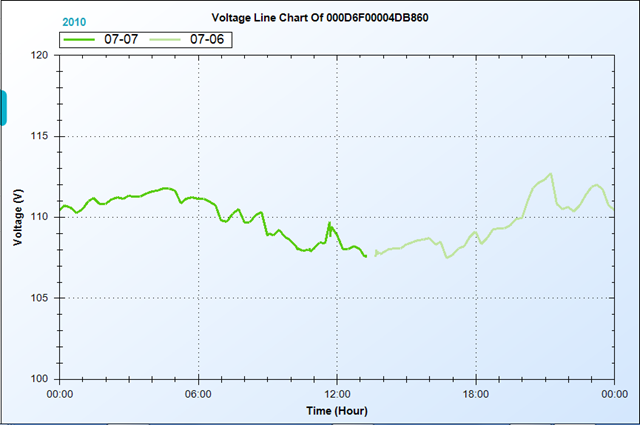
感覺外面的黑色框線
裡面的線條顏色就是不搭
在修改一下
        '給顏色吧!!========================================================================
        myPane.Legend.FontSpec.FontColor = Color.FromArgb(255, 100, 100, 100)
        myPane.Legend.Border.Color = Color.FromArgb(0, 255, 255, 255)
        myPane.Legend.Fill = New Fill(Color.FromArgb(0, 255, 255, 255), Color.FromArgb(0, 255, 255, 255), 0.0F)
        myPane.Title.FontSpec.FontColor = Color.FromArgb(255, 100, 100, 100)
        myPane.XAxis.Scale.FontSpec.FontColor = Color.FromArgb(255, 100, 100, 100)
        myPane.XAxis.Title.FontSpec.FontColor = Color.FromArgb(255, 100, 100, 100)
        myPane.YAxis.Scale.FontSpec.FontColor = Color.FromArgb(255, 100, 100, 100)
        myPane.YAxis.Title.FontSpec.FontColor = Color.FromArgb(255, 100, 100, 100)
        myPane.Chart.Border.Color = Color.FromArgb(255, 178, 214, 217) '圖表外框顏色
        myPane.XAxis.MajorGrid.Color = Color.FromArgb(255, 178, 214, 217) 'X 軸 虛線 顏色
        myPane.YAxis.MajorGrid.Color = Color.FromArgb(255, 178, 214, 217) 'Y 軸 虛線 顏色
        myPane.XAxis.MajorTic.Color = Color.FromArgb(255, 178, 214, 217)
        myPane.YAxis.MajorTic.Color = Color.FromArgb(255, 178, 214, 217)
        myPane.XAxis.MinorTic.Color = Color.FromArgb(255, 178, 214, 217)
        myPane.YAxis.MinorTic.Color = Color.FromArgb(255, 178, 214, 217)
        '沒辦法外框不能取消只能給他一個全透明的隨便顏色
        myPane.Border.Color = Color.FromArgb(0, 255, 255, 255)
        '==================================================================================
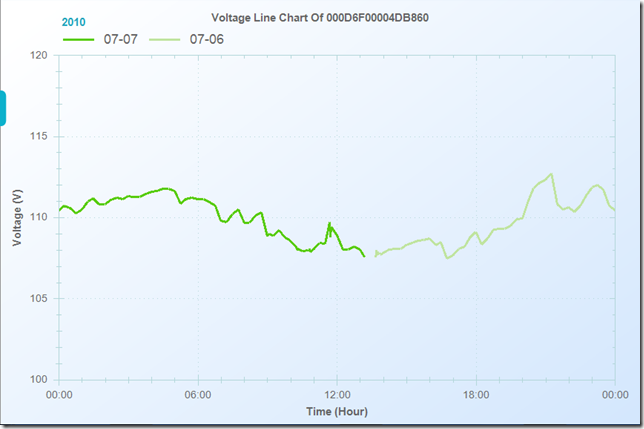
弄好就會向下面這樣
紀錄一下
免的自己忘記了
有興趣的大大也可以參考
小弟搞了這個元件搞了很久
新手新手
我是新手

