最近再進行Covid19 Global Forecasting Project ,所以紀錄Covid19預測過程 。
這篇會先介紹Data info與Data process
一. Training Data & Test Data
資料來源 : https://github.com/CSSEGISandData/COVID-19/tree/master/csse_covid_19_data
目前各大統計圖表資料大部分都是從此取得,不用WHO的資料是因為沒有提供Recovered_Case(復原人數)
此預測Recovered_Case是非常重要的變數,因此採用此來源。
import pandas as pd
#Recoveries_case data
Recoveries_url = 'https://raw.githubusercontent.com/CSSEGISandData/COVID-19/master/csse_covid_19_data/csse_covid_19_time_series/time_series_covid19_recovered_global.csv'
Recoveries_df = pd.read_csv(Recoveries_url, error_bad_lines=False)
Recoveries_df = Recoveries_df[(Recoveries_df['Lat']!=0) & (Recoveries_df['Long']!=0) ]

#Confirmed_case data
Confirmed_url = 'https://raw.githubusercontent.com/CSSEGISandData/COVID-19/master/csse_covid_19_data/csse_covid_19_time_series/time_series_covid19_confirmed_global.csv'
Confirmed_df = pd.read_csv(Confirmed_url, error_bad_lines=False)
Confirmed_df = Confirmed_df[(Confirmed_df['Lat']!=0) & (Confirmed_df['Long']!=0) ]

#Deaths_case data
Deaths_url = 'https://raw.githubusercontent.com/CSSEGISandData/COVID-19/master/csse_covid_19_data/csse_covid_19_time_series/time_series_covid19_deaths_global.csv'
Deaths_df = pd.read_csv(Deaths_url , error_bad_lines=False)
Deaths_df = Deaths_df[(Deaths_df['Lat']!=0) & (Deaths_df['Long']!=0) ]


#US_Confirmed_case data
US_Confirmed_url = 'https://raw.githubusercontent.com/CSSEGISandData/COVID-19/master/csse_covid_19_data/csse_covid_19_time_series/time_series_covid19_confirmed_US.csv'
US_Confirmed_df = pd.read_csv(US_Confirmed_url, error_bad_lines=False)

#US_Deaths_case data
US_Deaths_url = 'https://raw.githubusercontent.com/CSSEGISandData/COVID-19/master/csse_covid_19_data/csse_covid_19_time_series/time_series_covid19_deaths_US.csv'
US_Deaths_df = pd.read_csv(US_Deaths_url, error_bad_lines=False)
#US_Deaths_df = US_Deaths_df[(Deaths_df['Lat']!=0) & (Deaths_df['Long']!=0) ]
這邊全球與美國的確診、死亡人數是分開來的,我猜可能是美國後來爆發他們挪出來個案去分析
不過不影響我們去分析,各別讀出來再合併即可。
| Province/State | Country/Region | Lat | Long | 1/22/20 | 1/23/20 | 1/24/20 | 1/25/20 | 1/26/20 | 1/27/20 | ... | 4/19/20 | 4/20/20 | 4/21/20 | 4/22/20 | 4/23/20 | 4/24/20 | 4/25/20 | 4/26/20 | 4/27/20 | 4/28/20 | |
|---|---|---|---|---|---|---|---|---|---|---|---|---|---|---|---|---|---|---|---|---|---|
| 0 | NaN | Afghanistan | 33.000000 | 65.000000 | 0 | 0 | 0 | 0 | 0 | 0 | ... | 996 | 1026 | 1092 | 1176 | 1279 | 1351 | 1463 | 1531 | 1703 | 1828 |
| 1 | NaN | Albania | 41.153300 | 20.168300 | 0 | 0 | 0 | 0 | 0 | 0 | ... | 562 | 584 | 609 | 634 | 663 | 678 | 712 | 726 | 736 | 750 |
| 2 | NaN | Algeria | 28.033900 | 1.659600 | 0 | 0 | 0 | 0 | 0 | 0 | ... | 2629 | 2718 | 2811 | 2910 | 3007 | 3127 | 3256 | 3382 | 3517 | 3649 |
| 3 | NaN | Andorra | 42.506300 | 1.521800 | 0 | 0 | 0 | 0 | 0 | 0 | ... | 713 | 717 | 717 | 723 | 723 | 731 | 738 | 738 | 743 | 743 |
| 4 | NaN | Angola | -11.202700 | 17.873900 | 0 | 0 | 0 | 0 | 0 | 0 | ... | 24 | 24 | 24 | 25 | 25 | 25 | 25 | 26 | 27 | 27 |
| ... | ... | ... | ... | ... | ... | ... | ... | ... | ... | ... | ... | ... | ... | ... | ... | ... | ... | ... | ... | ... | ... |
| 259 | Saint Pierre and Miquelon | France | 46.885200 | -56.315900 | 0 | 0 | 0 | 0 | 0 | 0 | ... | 1 | 1 | 1 | 1 | 1 | 1 | 1 | 1 | 1 | 1 |
| 260 | NaN | South Sudan | 6.877000 | 31.307000 | 0 | 0 | 0 | 0 | 0 | 0 | ... | 4 | 4 | 4 | 4 | 5 | 5 | 5 | 6 | 6 | 34 |
| 261 | NaN | Western Sahara | 24.215500 | -12.885800 | 0 | 0 | 0 | 0 | 0 | 0 | ... | 6 | 6 | 6 | 6 | 6 | 6 | 6 | 6 | 6 | 6 |
| 262 | NaN | Sao Tome and Principe | 0.186360 | 6.613081 | 0 | 0 | 0 | 0 | 0 | 0 | ... | 4 | 4 | 4 | 4 | 4 | 4 | 4 | 4 | 4 | 8 |
| 263 | NaN | Yemen | 15.552727 | 48.516388 | 0 | 0 | 0 | 0 | 0 | 0 | ... | 1 | 1 | 1 | 1 | 1 | 1 | 1 | 1 | 1 | 1 |
確診資料如上,欄位名稱蠻好理解的,這邊我就不多加闡述
而我想要讓Training data轉換成的格式如下 :
| Province_State | Country_Region | Date | ConfirmedCases | |
|---|---|---|---|---|
| 0 | NaN | Afghanistan | 2020/1/22 | 0 |
| 1 | NaN | Afghanistan | 2020/1/23 | 0 |
| 2 | NaN | Afghanistan | 2020/1/24 | 0 |
| 3 | NaN | Afghanistan | 2020/1/25 | 0 |
| 4 | NaN | Afghanistan | 2020/1/26 | 0 |
| ... | ... | ... | ... | ... |
| 25377 | NaN | Sao Tome and Principe | 2020/4/24 | 4 |
| 25378 | NaN | Sao Tome and Principe | 2020/4/25 | 4 |
| 25379 | NaN | Sao Tome and Principe | 2020/4/26 | 4 |
| 25380 | NaN | Sao Tome and Principe | 2020/4/27 | 4 |
| 25381 | NaN | Sao Tome and Principe | 2020/4/28 | 8 |
轉換過程如下:
def DataTransform(df):
    data_list = []
    #刪除Lat、Long欄位
    del df['Lat']
    del df['Long']
    #行列轉置
    for n in range(0,len(df)-1):
        Date = df.iloc[n,2:].index.values.tolist()
        Recoveries=df.iloc[n,2:].values.tolist()
        Country = df.iloc[n:n+1,1:2].values.tolist()
        Province = df.iloc[n:n+1,0:1].values.tolist()
        for j in range(0,len(Province)):
            for i in range(0,len(Date)):
                day = Date[i].split('/')[1]
                month = Date[i].split('/')[0]
                year = "20"+Date[i].split('/')[2]
                Date_ = year+"/"+month+"/"+day
                data_list.extend([[Province[j][0],Country[j][0],Date_,Recoveries[i]]])
    return data_list


Recoveries_list = DataTransform(Recoveries_df)
Confirmed_list = DataTransform(Confirmed_df)
Deaths_list = DataTransform(Deaths_df)

Trans_Recoveries_df = pd.DataFrame(data = Recoveries_list,columns =['Province_State','Country_Region','Date','Recoveries'])
Trans_Confirmed_df = pd.DataFrame(data = Confirmed_list ,columns =['Province_State','Country_Region','Date','ConfirmedCases'])
Trans_Deaths_df = pd.DataFrame(data = Deaths_list ,columns =['Province_State','Country_Region','Date','Deaths'])
全球的資料經由上述程式碼就完成了,美國的資料我這邊就不寫了,各位可以練習看看。
最後將Global Data & US Date concat就是我們的Training data
Test date 格式也一樣,轉換過程如下:
Test_list = []
TestDate = ['2020/4/1','2020/4/2','2020/4/3','2020/4/4','2020/4/5','2020/4/6','2020/4/7','2020/4/8','2020/4/9','2020/4/10','2020/4/11','2020/4/12','2020/4/13','2020/4/14','2020/4/15','2020/4/16','2020/4/17','2020/4/18','2020/4/19','2020/4/20','2020/4/21','2020/4/22','2020/4/23','2020/4/24','2020/4/25','2020/4/26','2020/4/27','2020/4/28','2020/4/29','2020/4/30']
tmp = train.drop_duplicates(subset=['Province_State','Country_Region'], keep='first')
Test_Province_State = tmp['Province_State'].values.tolist()
Test_Country_Region = tmp['Country_Region'].values.tolist()
for i in range(0,len(Test_Province_State)):
    for j in range(0,len(TestDate)):
        Test_list.extend([[Test_Province_State[i],Test_Country_Region[i],TestDate[j]]])
Test_df = pd.DataFrame(data = Test_list,columns =['Province_State','Country_Region','Date'])
Test_df.index.names = ['ForecastId']
Test data轉換成的格式如下 :
| Province_State | Country_Region | Date | |
|---|---|---|---|
| ForecastId | |||
| 0 | NaN | Afghanistan | 2020/4/1 |
| 1 | NaN | Afghanistan | 2020/4/2 |
| 2 | NaN | Afghanistan | 2020/4/3 |
| 3 | NaN | Afghanistan | 2020/4/4 |
| 4 | NaN | Afghanistan | 2020/4/5 |
| ... | ... | ... | ... |
| 9475 | Wyoming | US | 2020/4/26 |
| 9476 | Wyoming | US | 2020/4/27 |
| 9477 | Wyoming | US | 2020/4/28 |
| 9478 | Wyoming | US | 2020/4/29 |
| 9479 | Wyoming | US | 2020/4/30 |
二. Visualizations
會簡單呈現幾個圖表,其實對預測幫助甚少,只是好看而已 (誤
import pycountry_convert as pc
import pycountry
import plotly.express as px

class country_utils():
    def __init__(self):
        self.d = {}

    def get_dic(self):
        return self.d

    def get_country_details(self,country):
        """Returns country code(alpha_3) and continent"""
        try:
            country_obj = pycountry.countries.get(name=country)
            if country_obj is None:
                c = pycountry.countries.search_fuzzy(country)
                country_obj = c[0]
            continent_code = pc.country_alpha2_to_continent_code(country_obj.alpha_2)
            continent = pc.convert_continent_code_to_continent_name(continent_code)
            return country_obj.alpha_3, continent
        except:
            #國家名修改,不然抓不到對應國家
            if 'Congo' in country:
                country = 'Congo'
            elif country == 'Diamond Princess' or country == 'Laos' or country == 'MS Zaandam'\
            or country == 'Holy See' or country == 'Timor-Leste':
                return country, country
            elif country == 'Korea, South' or country == 'South Korea':
                country = 'Korea, Republic of'
            elif country == 'Taiwan*':
                country = 'Taiwan'
            elif country == 'Burma':
                country = 'Myanmar'
            elif country == 'West Bank and Gaza':
                country = 'Gaza'
            else:
                return country, country
            country_obj = pycountry.countries.search_fuzzy(country)
            continent_code = pc.country_alpha2_to_continent_code(country_obj[0].alpha_2)
            continent = pc.convert_continent_code_to_continent_name(continent_code)
            return country_obj[0].alpha_3, continent

    def get_iso3(self, country):
        return self.d[country]['code']

    def get_continent(self,country):
        return self.d[country]['continent']

    def add_values(self,country):
        self.d[country] = {}
        self.d[country]['code'],self.d[country]['continent'] = self.get_country_details(country)

    def fetch_iso3(self,country):
        if country in self.d.keys():
            return self.get_iso3(country)
        else:
            self.add_values(country)
            return self.get_iso3(country)

    def fetch_continent(self,country):
        if country in self.d.keys():
            return self.get_continent(country)
        else:
            self.add_values(country)
            return self.get_continent(country)

df_map = all_train.copy()
df_map['Date'] = df_map['Date'].astype(str)
df_map = df_map.groupby(['Date','Country_Region'], as_index=False)['ConfirmedCases','Fatalities'].sum()
obj = country_utils()
df_map['iso_alpha'] = df_map.apply(lambda x: obj.fetch_iso3(x['Country_Region']), axis=1)
#取log才能讓各國產生差異感
df_map['log(ConfirmedCases)'] = np.log(df_map.ConfirmedCases + 1)
df_map['log(Fatalities)'] = np.log(df_map.Fatalities + 1)

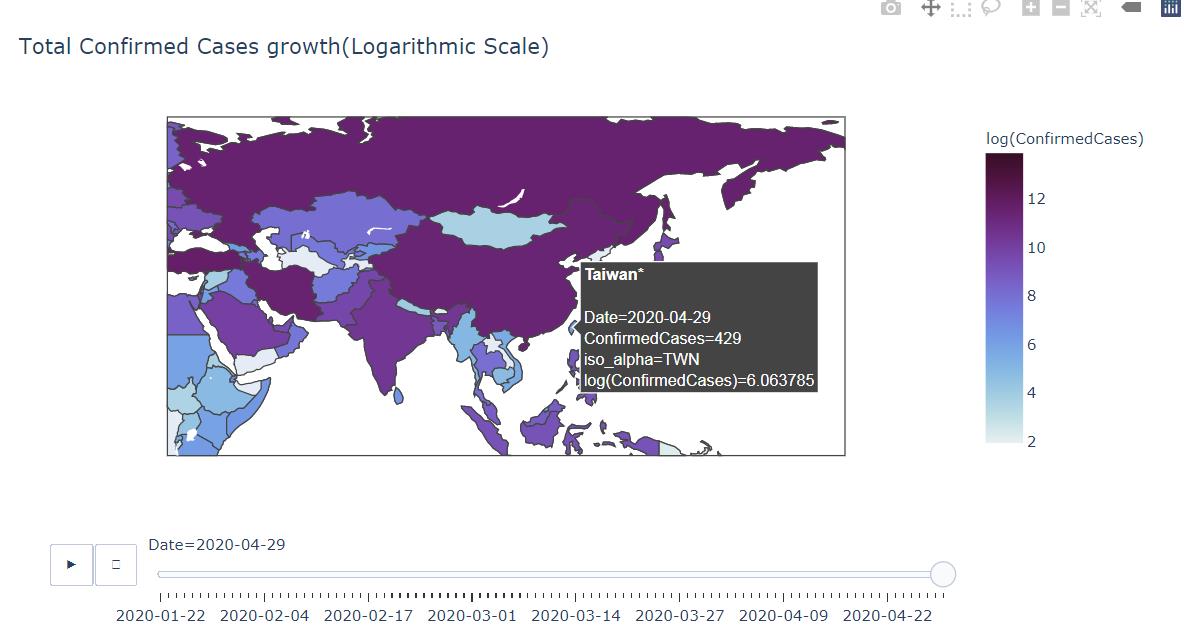
px.choropleth(df_map,
              locations="iso_alpha",
              color="log(ConfirmedCases)",
              hover_name="Country_Region",
              hover_data=["ConfirmedCases"] ,
              animation_frame="Date",
              color_continuous_scale=px.colors.sequential.dense,
              title='Total Confirmed Cases growth')
Output

import plotly.graph_objects as go
def add_daily_measures(df):
    df.loc[0,'Daily Cases'] = df.loc[0,'ConfirmedCases']
    df.loc[0,'Daily Deaths'] = df.loc[0,'Fatalities']
    for i in range(1,len(df)):
        df.loc[i,'Daily Cases'] = df.loc[i,'ConfirmedCases'] - df.loc[i-1,'ConfirmedCases']
        df.loc[i,'Daily Deaths'] = df.loc[i,'Fatalities'] - df.loc[i-1,'Fatalities']

    df.loc[0,'Daily Cases'] = 0
    df.loc[0,'Daily Deaths'] = 0
    return df

df_world = all_train.copy()
df_world = df_world.groupby('Date',as_index=False)['ConfirmedCases','Fatalities'].sum()
df_world = add_daily_measures(df_world)
df_world['Cases:7-day rolling average'] = df_world['Daily Cases'].rolling(7).mean()
df_world['Deaths:7-day rolling average'] = df_world['Daily Deaths'].rolling(7).mean()


fig = go.Figure(data=[
    go.Bar(name='Cases', x=df_world['Date'], y=df_world['Daily Cases']),
    go.Bar(name='Deaths', x=df_world['Date'], y=df_world['Daily Deaths'])])

fig.add_trace(go.Scatter(name='Cases:7-day rolling average',x=df_world['Date'],y=df_world['Cases:7-day rolling average'],marker_color='black'))
fig.add_trace(go.Scatter(name='Deaths:7-day rolling average',x=df_world['Date'],y=df_world['Deaths:7-day rolling average'],marker_color='darkred'))


fig.update_layout(barmode='overlay', title='Worldwide daily Case and Death count',showlegend=False)
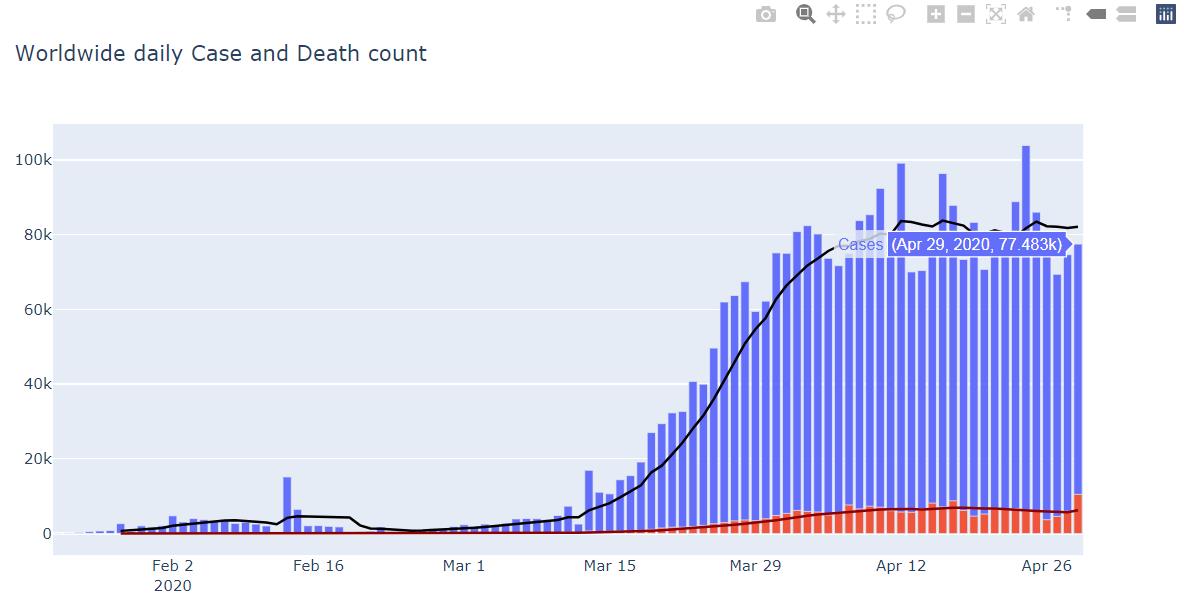
fig.show()
Output

大致上,疫情已經呈現趨緩的現象,不過國外學者預計還會有第二波高潮,只能希望疫苗的出現。
三. Create Feature
由於原史資料給的資訊實在是太少,我們必須增加Feature
這部分我主要的做法有兩種
- creating lag features
- create ConfirmedCases、DeathsCase 1~N days diff rate
Lag features大家比較熟悉,不清楚的網路資料也很多,這邊就不多加闡述
ConfirmedCases、DeathsCase 1~N days diff rate 變數名稱如下:
- (確診 - 死亡 - 康復) / 確診
- 確診 / 人口
- 1~3天,前後確診差
- 1~3天,前後死亡差
- 1~3天,確診與死亡平均差
- 1~2天、2~3天,死亡差的比例
- 1~2天、2~3天,確診差的比例
- 1~2天、2~3天,確診差的比例平均
- 1~2天、2~3天,死亡差的比例平均
- 1~3天,確診比例
- 1~3天,死亡比例
- N、N+3天,確診比例
- N、N+3天,死亡比例
- 第1、10、50、100、200天確診人數
- 第1、10、50、100、200天死亡人數
- 第1、10、50、100、200天復原人數
經由變數擴增讓整體資料有更多的變數指標,這些指標會讓整體預測有相當程度的提升,詳細程式碼會在後面的part再做解釋
下一篇會對Model做介紹