使用LibreNMS 自定功能,監控主機上特定Port 的連線數量
因為需要知道目前主機的特定Port連線數,所以做了這個功能,總共要設定三個地方。(異常處理見最後)
Poller Module
- 檔案名稱: /opt/librenms/includes/polling/server-port-common-poller.inc.php
- 功能: 呼叫一次SNMP後,對取回內容處理,統計關心的Port連線數及特定狀態連線數。
- 程式內容:
<?php

  use LibreNMS\RRD\RrdDefinition;

  #本程式使用的SNMP MIB及OID
  $mibname="TCP-MIB";
  $oid="tcpConnectionState.ipv4";

  $esport80=0;
  $esport443=0;
  $esport1433=0;
  $esport3389=0;
  $esport8080=0;
  $esport8443=0;
  $establishedtotal=0;
  $totalportcount=0;
  $timeWaitCount=0;
  $closeWaitCount=0;
  $synSentCount=0;

  #組合要用到的regular expression
  $exprhead = '/ipv4\\.(("[^"]+")|(\\d{0,3}\\.\\d{0,3}\\.\\d{0,3}\\.\\d{0,3}))\\.' ;
  $exprend  = '\.ipv4/' ;
  $expr80   = $exprhead . '80'   . $exprend ;
  $expr443  = $exprhead . '443'  . $exprend ;
  $expr1433 = $exprhead . '1433' . $exprend ;
  $expr3389 = $exprhead . '3389' . $exprend ;
  $expr8080 = $exprhead . '8080' . $exprend ;
  $expr8443 = $exprhead . '8443' . $exprend ;

  #利用snmp取得主機的SNMP值
  $data = snmpwalk_cache_multi_oid($device, $oid, $data, $mibname);

  #不要多次呼叫SNMP,所以取得資料後以迴圈統計
  foreach ($data as $key => $value)
  {
    if ($value["tcpConnectionState"] == "established")
    {
      /*
      #Debug 用來檢查迴圈值用
      echo ("### key=(" . $key . ") value=(" . implode(", ",$value) . ")\n" );
      */

      if ( preg_match($expr80, $key) == 1)
      {
        $esport80++;
      } elseif( preg_match($expr443, $key) == 1)
      {
        $esport443++;
      } elseif( preg_match($expr1433, $key) == 1)
      {
        $esport1433++;
      } elseif( preg_match($expr3389, $key) == 1)
      {
        $esport3389++;
      } elseif( preg_match($expr8080, $key) == 1)
      {
        $esport8080++;
      } elseif( preg_match($expr8443, $key) == 1)
      {
        $esport8443++;
      }
      $totalportcount++;
    } elseif ($value["tcpConnectionState"] == "timeWait")
    {
      $timeWaitCount++;
      $totalportcount++;
    } elseif($value["tcpConnectionState"] == "closeWait")
    {
      $closeWaitCount++;
      $totalportcount++;
    }elseif ($value["tcpConnectionState"] == "synSent")
    {
      $synSentCount++;
      $totalportcount++;
    }
  }

  if (is_numeric($esport80) && is_numeric($esport443) && is_numeric($esport1433) && is_numeric($esport3389) && is_numeric($esport8080) && is_numeric($esport8443) && is_numeric($establishedtotal) && is_numeric($totalportcount) && is_numeric($timeWaitCount) && is_numeric($closeWaitCount) && is_numeric($synSentCount)) {
    $rrd_def = RrdDefinition::make()
      ->addDataset('esport80', 'GAUGE', 0)
      ->addDataset('esport443', 'GAUGE', 0)
      ->addDataset('esport1433', 'GAUGE', 0)
      ->addDataset('esport3389', 'GAUGE', 0)
      ->addDataset('esport8080', 'GAUGE', 0)
      ->addDataset('esport8443', 'GAUGE', 0)
      ->addDataset('establishedtotal', 'GAUGE', 0)
      ->addDataset('totalportcount', 'GAUGE', 0)
      ->addDataset('timeWaitCount', 'GAUGE', 0)
      ->addDataset('closeWaitCount', 'GAUGE', 0)
      ->addDataset('synSentCount', 'GAUGE', 0);

    $fields = [
      'esport80'         => $esport80,
      'esport443'        => $esport443,
      'esport1433'       => $esport1433,
      'esport3389'       => $esport3389,
      'esport8080'       => $esport8080,
      'esport8443'       => $esport8443,
      'establishedtotal' => $establishedtotal,
      'totalportcount'   => $totalportcount,
      'timeWaitCount'    => $timeWaitCount,
      'closeWaitCount'   => $closeWaitCount,
      'synSentCount'     => $synSentCount,
    ];

    /*
    搭配上面迴圈內的Debug,可以用來檢查程式跑出來結果是不是符合預期
    #Debug use: ./poller.php -h <serverip> -m server-port-common-poller -d
    echo ("######################################################\n");
    echo ("exprhead = " . $exprhead  . "\n" );
    echo ("exprend  = " . $exprend   . "\n" );
    echo ("expr80   = " . $expr80    . "\n" );
    echo ("expr443  = " . $expr443   . "\n" );
    echo ("expr1433 = " . $expr1433  . "\n" );
    echo ("expr3389 = " . $expr3389  . "\n" );
    echo ("expr8080 = " . $expr8080  . "\n" );
    echo ("expr8443 = " . $expr8443  . "\n" );
    echo ("\n");
    foreach ($fields as $key => $value)
    {
       echo("key=" . $key . "  ,  value=" . $value . "\n");
    }
    echo ("######################################################\n");
    */

        $tags = compact('rrd_def');

        #Poller Module將處理資料存入「server_port_common_graph」
        data_update($device, 'server_port_common_graph', $tags, $fields);

        $os->enableGraph('server_port_common_graph');
    }

    unset($data, $rrd_def, $fields, $oid, $mibname);
//end if
Graph
- 檔案名稱: /opt/librenms/includes/html/graphs/device/server_port_common_graph.inc.php
很重要:這裡檔名跟Poller Module不同,檔名不能用「-」號,只能用底線「_」,不然LibreNMS會認不出來。
圖片就不會顯示!
圖片就不會顯示!
圖片就不會顯示! - 功能: 門將Poller取得的值顯示在畫面上。
- 程式內容:
<?php

$scale_min = '0';

require 'includes/html/graphs/common.inc.php';

#Poller Module將處理資料存入「server_port_common_graph」
#rrd從「server_port_common_graph」取值,並繪圖

$rrd_filename = Rrd::name($device['hostname'], 'server_port_common_graph');

$rrd_options .= " DEF:esport80=$rrd_filename:esport80:AVERAGE";
$rrd_options .= " DEF:esport443=$rrd_filename:esport443:AVERAGE";
$rrd_options .= " DEF:esport1433=$rrd_filename:esport1433:AVERAGE";
$rrd_options .= " DEF:esport3389=$rrd_filename:esport3389:AVERAGE";
$rrd_options .= " DEF:esport8080=$rrd_filename:esport8080:AVERAGE";
$rrd_options .= " DEF:esport8443=$rrd_filename:esport8443:AVERAGE";
$rrd_options .= " DEF:establishedtotal=$rrd_filename:establishedtotal:AVERAGE";
$rrd_options .= " DEF:timeWaitCount=$rrd_filename:timeWaitCount:AVERAGE";
$rrd_options .= " DEF:closeWaitCount=$rrd_filename:closeWaitCount:AVERAGE";
$rrd_options .= " DEF:synSentCount=$rrd_filename:synSentCount:AVERAGE";
$rrd_options .= " DEF:totalportcount=$rrd_filename:totalportcount:AVERAGE";

$rrd_options .= " COMMENT:'Sessions            Current    Average    Maximum\\n'";

# %6.0 表示數字格式為整數6位; Line1表示寬一個畫素的線,要粗一點,也有Line1.25的用法
# 詳細可以找rrd 文件參考
$rrd_options .= ' LINE1:esport80#FF0000:Port80        ';
$rrd_options .= " GPRINT:esport80:LAST:'%6.0lf'";
$rrd_options .= " GPRINT:esport80:AVERAGE:' %6.0lf'";
$rrd_options .= " GPRINT:esport80:MAX:' %6.0lf\\\\n'";

$rrd_options .= ' LINE1:esport443#FF00FF:Port443       ';
$rrd_options .= " GPRINT:esport443:LAST:'%6.0lf'";
$rrd_options .= " GPRINT:esport443:AVERAGE:' %6.0lf'";
$rrd_options .= " GPRINT:esport443:MAX:' %6.0lf\\\\n'";

$rrd_options .= ' LINE1:esport1433#0000FF:Port1433      ';
$rrd_options .= ' GPRINT:esport1433:LAST:%6.0lf';
$rrd_options .= " GPRINT:esport1433:AVERAGE:' %6.0lf'";
$rrd_options .= " GPRINT:esport1433:MAX:' %6.0lf\\\\n'";

$rrd_options .= ' LINE1:esport3389#FFD660:Port3389      ';
$rrd_options .= ' GPRINT:esport3389:LAST:%6.0lf';
$rrd_options .= " GPRINT:esport3389:AVERAGE:' %6.0lf'";
$rrd_options .= " GPRINT:esport3389:MAX:' %6.0lf\\\\n'";

$rrd_options .= ' LINE1:esport8080#6EA100:Port8080      ';
$rrd_options .= " GPRINT:esport8080:LAST:'%6.0lf'";
$rrd_options .= " GPRINT:esport8080:AVERAGE:' %6.0lf'";
$rrd_options .= " GPRINT:esport8080:MAX:' %6.0lf\\\\n'";

$rrd_options .= ' LINE1:esport8443#6DC8FE:Port8443      ';
$rrd_options .= " GPRINT:esport8443:LAST:'%6.0lf'";
$rrd_options .= " GPRINT:esport8443:AVERAGE:' %6.0lf'";
$rrd_options .= " GPRINT:esport8443:MAX:' %6.0lf\\\\n'";

$rrd_options .= ' LINE1:establishedtotal#9FA4EE:Established   ';
$rrd_options .= " GPRINT:establishedtotal:LAST:'%6.0lf'";
$rrd_options .= " GPRINT:establishedtotal:AVERAGE:' %6.0lf'";
$rrd_options .= " GPRINT:establishedtotal:MAX:' %6.0lf\\\\n'";

$rrd_options .= ' LINE1:timeWaitCount#8D00BA:Time_Wait     ';
$rrd_options .= " GPRINT:timeWaitCount:LAST:'%6.0lf'";
$rrd_options .= " GPRINT:timeWaitCount:AVERAGE:' %6.0lf'";
$rrd_options .= " GPRINT:timeWaitCount:MAX:' %6.0lf\\\\n'";

$rrd_options .= ' LINE1:closeWaitCount#CCBB00:Close_Wait    ';
$rrd_options .= " GPRINT:closeWaitCount:LAST:'%6.0lf'";
$rrd_options .= " GPRINT:closeWaitCount:AVERAGE:' %6.0lf'";
$rrd_options .= " GPRINT:closeWaitCount:MAX:' %6.0lf\\\\n'";

$rrd_options .= ' LINE1:synSentCount#008A6D:Syn_Sent      ';
$rrd_options .= " GPRINT:synSentCount:LAST:'%6.0lf'";
$rrd_options .= " GPRINT:synSentCount:AVERAGE:' %6.0lf'";
$rrd_options .= " GPRINT:synSentCount:MAX:' %6.0lf\\\\n'";

$rrd_options .= ' LINE1.25:totalportcount#750F7D:TotalPort     ';
$rrd_options .= " GPRINT:totalportcount:LAST:'%6.0lf'";
$rrd_options .= " GPRINT:totalportcount:AVERAGE:' %6.0lf'";
$rrd_options .= " GPRINT:totalportcount:MAX:' %6.0lf\\\\n'";
config.php
- 檔案名稱: /opt/librenms/config.php
- 功能: 將Poller Module及Graph掛載到LibreNMS上。
- 程式內容:
#在config.php內增加以下設定
#底下true表示預設套用到各設備上。若不要預設套用則設為false,然後到要啟用的主機→設定(齒輪)→Modules→Poller Modules 啟用
$config['poller_modules']['server-port-common-poller'] = true;
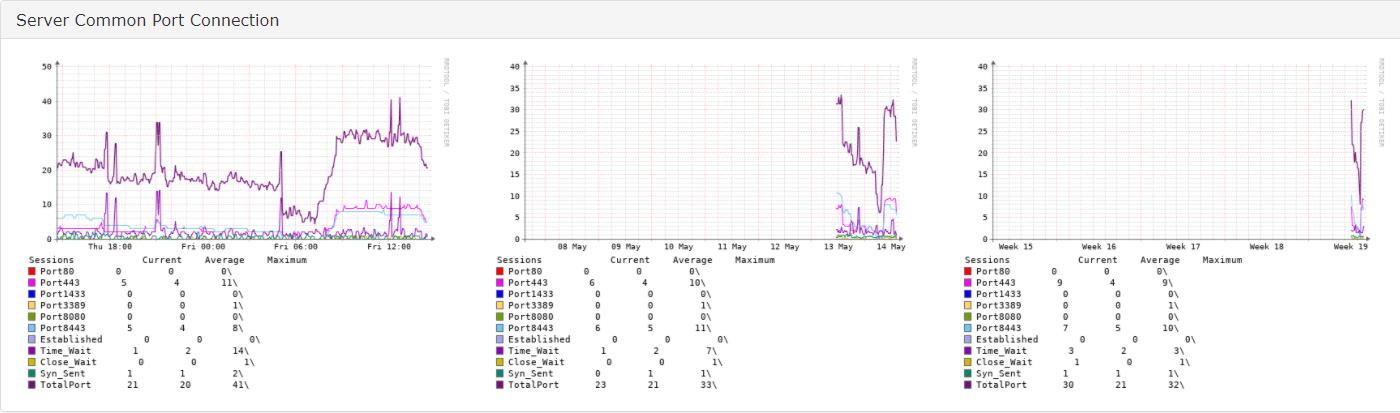
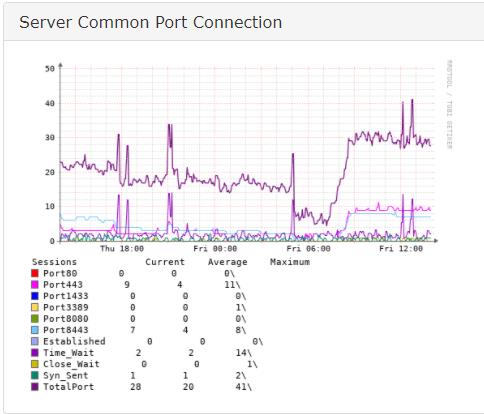
#設定掛載RRD圖,掛在主機→Graph→Netstats 底下的Server Common Port Connection 區段下
$config['graph_types']['device']['server_port_common_graph'] = ['section' => 'netstats', 'order' => 0, 'descr' => 'Server Common Port Connection'];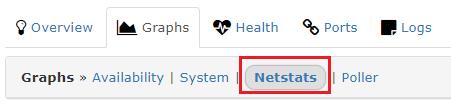
補充說明
- 設定若有異常或程式有錯,則在指定的位置下(本例為Netstats)不會有任何圖出現。
- 可以在/opt/librenms 用底下的指令測試,若有錯誤會直接看到。
- 打開程式裡 Debug區段可以直接看到變數內容是不是跟預期的相同。
- 此設定內容,「不會」出現在Global Setting→Poller→Poller Modules 底下。
- 此設定內容,「會」出現在單台主機的→Edit(齒輪)→Modules→Poller Modules底下,並可On、Off。
- 若一切正常,可以直接在單台主機的→Graph→Netstats底下看到。
- 若RRD繪圖有問題,可以選到該圖片後,點選「Show RRD Command」,RRD會有訊息可以參考。
./poller.php -h <serverip> -m server-port-common-poller -d<異常處理>
圖形出現Error … No DS Called xxxxx 時
在設定過程中如果設定錯誤,可能導致rrd檔內容錯誤。好在每個圖形是單獨一個rrd檔,只要刪除讓它重新產生就好,不會影響其它項目累積的資訊。
- 移至"/data/rrd" 目錄下,或自己定義的rrd所在位置。
- 如果針對單一主機,可以直接刪除主機名稱目錄下的 特定rrd檔案。如:./my_server_ip/server_port_common_graph.rrd
- 如果想一次刪除全部的特定的rrd檔案(因為設定錯誤後,可能就全部大量產生),可用以下指令:
#檢視符合的檔案清單(建議看下有沒有意外的檔案)
find ./ -name server_port_common_graph.rrd

#檢視相關檔案詳細資訊(需要檢視檔案日期、大小時)(空白都不能少)
find ./ -name server_port_common_graph.rrd -exec ls -al {} \;

#執行批次刪除(請審慎小心)(空白都不能少)
find ./ -name server_port_common_graph.rrd -exec rm {} \;