之所以有 remote dubeg 的需求是因為我的 raspberry pi 沒有接螢幕,都是透過 ssh 來跑程式的,但是有時候如果沒有辦法 step by step debug,有時候會很難抓出問題點在哪裡,目前可以做到是預先把程式先放到遠端上,透過 node.js 的 debug 參數來執行程式,接著讓 vscode attach 到遠端的 process
適用版本: node.js 6.x,其他版本可能也可以,但是我沒有試過...
備註: node.js 8.x 在 debug 的時候會有中斷點沒有被觸發的問題,就直接執行過去了...
- 先把整個 node.js app 資料夾放到 remote 機器上,並記下 remote ip 跟路徑
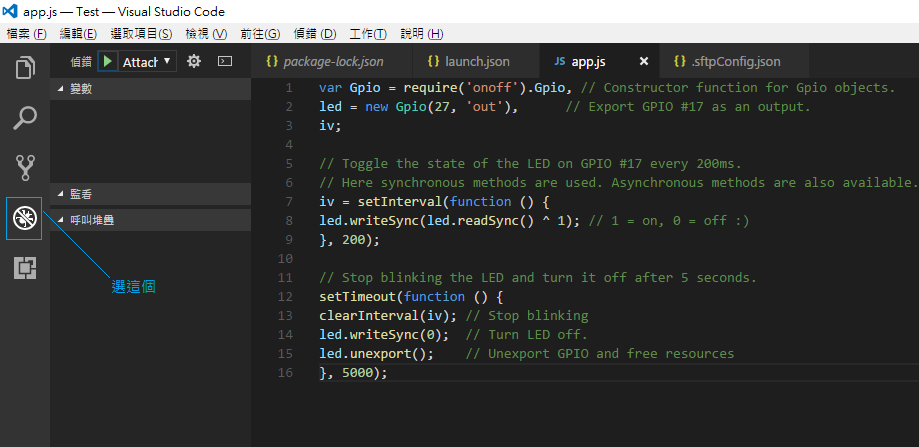
- 在 VS Code 中選左邊第四個 debug 分頁
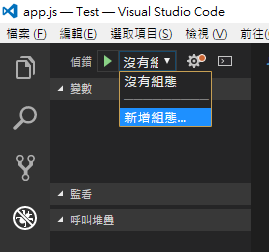
- 在開始的箭頭旁邊,點選組態設定中的新增組態,如果點了沒反應可能是還沒有產生 launch.json 組態檔案,可以先按一次 f5 讓他直接執行並生出 launch.json,生出來之後再去新增祖態,這感覺是 VS Code 的 bug
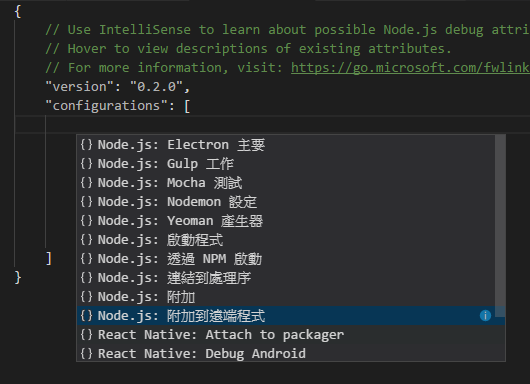
- 選擇 Node.js: 附加到遠端程式,VS Code 會自動幫你產生 json 範本
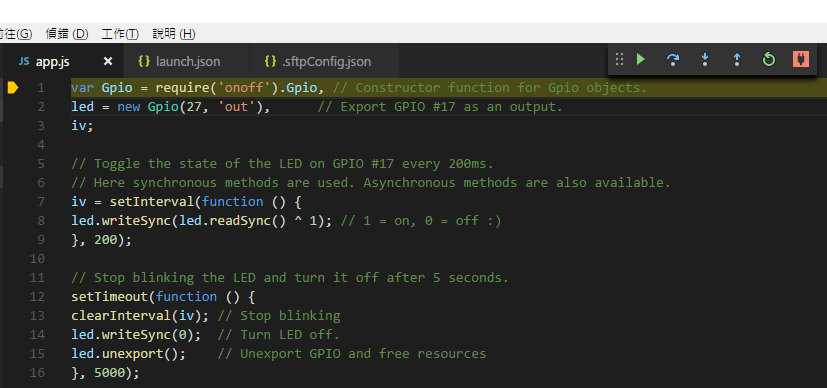
- 把 ip、port、跟 app 位置填好,去掉其他部分,檔案大概會長這樣,假設我在 remote 的 app 放在 /home/joe/test
{ // Use IntelliSense to learn about possible Node.js debug attributes. // Hover to view descriptions of existing attributes. // For more information, visit: https://go.microsoft.com/fwlink/?linkid=830387 "version": "0.2.0", "configurations": [ { "type": "node", "request": "attach", "name": "Attach to Remote", "address": "10.0.0.97", // remote ip 位置 "port": 5858, // port "localRoot": "${workspaceRoot}", "remoteRoot": "/home/joe/test" // app 所在路徑資料夾 } ] } -
在 remote 那台機器上輸入下面指令,會出現 Debugger listening on [::]:5858
cd /home/joe/test nodejs --debug-brk app.js -
在 VS Code 中按 f5 開始 debug,就會看到中斷點停在程式第一行囉,就跟在本機上 debug 一樣了