在prompt內文可以要求AI寫程式並執行
分享一個組prompt同時呼叫Code Interpreter 讓LLM幫你寫程式並執行(另外要收費), 可叫LLM幫你產檔或畫圖,
上行範例如下:
{
"model": "gpt-5-mini",
"input": [
{
"role": "user",
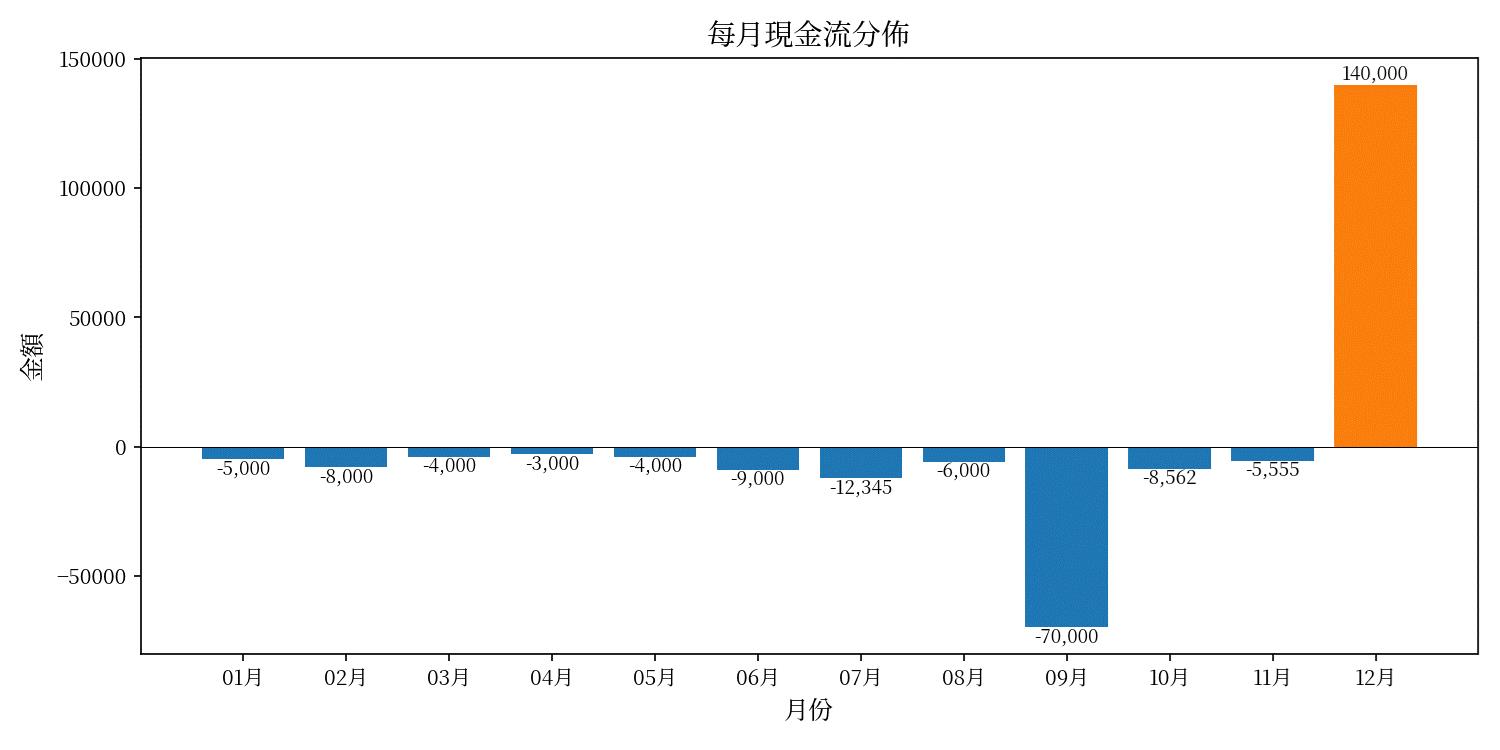
"content": "以下是一組現金流(日期 + 金額),請使用 python tool 計算 XIRR,並產生一張現金流分佈的直方圖, x軸為月份,y軸為金額, 要小心中文字不要變亂碼,最後回傳計算結果並附圖:\n\n2026/1/1 -5000\n2026/2/1 -8000\n2026/3/1 -4000\n2026/4/1 -3000\n2026/5/1 -4000\n2026/6/1 -9000\n2026/7/1 -12345\n2026/8/1 -6000\n2026/9/1 -70000\n2026/10/1 -8562\n2026/11/1 -5555\n2026/12/1 140000"
}
],
"tools": [
{
"type": "code_interpreter",
"container": {
"type": "auto"
}
}
],
"tool_choice": "auto"
}
回傳結果:
依以下json結果下載的圖片:
{
  ...略...
  "output": [
    {
      "id": "rs_0d2794e1ebce33f3006a3e3cc611548196a361905aa3016302",
      "type": "reasoning",
      "summary": []
    },
    {
      "id": "ci_0d2794e1ebce33f3006a3e3ccf82c48196ab45f2a3ba058490",
      "type": "code_interpreter_call",
      "status": "completed",
      "code": "# 計算 XIRR 並繪製現金流每月分佈圖 (中文標籤處理)\r\nimport numpy as np\r\nimport matplotlib.pyplot as plt\r\nfrom matplotlib import font_manager as fm\r\nfrom datetime import datetime\r\nimport os\r\n\r\n# 現金流資料 (日期, 金額)\r\ndata = [\r\n    (\"2026/1/1\", -5000),\r\n    (\"2026/2/1\", -8000),\r\n    (\"2026/3/1\", -4000),\r\n    (\"2026/4/1\", -3000),\r\n    (\"2026/5/1\", -4000),\r\n    (\"2026/6/1\", -9000),\r\n    (\"2026/7/1\", -12345),\r\n    (\"2026/8/1\", -6000),\r\n    (\"2026/9/1\", -70000),\r\n    (\"2026/10/1\", -8562),\r\n    (\"2026/11/1\", -5555),\r\n    (\"2026/12/1\", 140000),\r\n]\r\n\r\n# 解析日期與金額\r\ndates = [datetime.strptime(d, \"%Y/%m/%d\") for d, _ in data]\r\namounts = np.array([a for _, a in data], dtype=float)\r\n\r\n# XIRR 函數實作 (使用 Newton-Raphson 與 bisection 作為 fallback)\r\ndef xirr(dates, amounts, guess=0.1, tol=1e-8, maxiter=200):\r\n    # 以第一個日期為基準計算天數差 (年為單位)\r\n    days = np.array([(d - dates[0]).days for d in dates], dtype=float)\r\n    def f(r):\r\n        return np.sum(amounts / ((1.0 + r) ** (days / 365.0)))\r\n    def df(r):\r\n        return np.sum(- (days / 365.0) * amounts / ((1.0 + r) ** (days / 365.0 + 1.0)))\r\n    \r\n    # 初始 guess,避免 r <= -1\r\n    r = guess\r\n    if r <= -0.999999:\r\n        r = 0.1\r\n    # Newton-Raphson\r\n    for i in range(maxiter):\r\n        try:\r\n            fr = f(r)\r\n            dfr = df(r)\r\n        except Exception:\r\n            break\r\n        if abs(fr) < tol:\r\n            return r\r\n        # 若導數太小或會造成數值問題,跳出使用二分法\r\n        if dfr == 0 or not np.isfinite(dfr):\r\n            break\r\n        r_new = r - fr / dfr\r\n        if not np.isfinite(r_new):\r\n            break\r\n        # 若新 r 趨近於 -1,避免無效值\r\n        if r_new <= -0.999999:\r\n            break\r\n        # 收斂\r\n        if abs(r_new - r) < tol:\r\n            return r_new\r\n        r = r_new\r\n    \r\n    # 二分法尋找根 (先找 bracket)\r\n    lo, hi = -0.999999, 10.0\r\n    flo, fhi = f(lo + 1e-12), f(hi)  # avoid exactly -1\r\n    # 嘗試擴展 hi 直到與 lo 異號或達上限\r\n    attempts = 0\r\n    while flo * fhi > 0 and attempts < 100:\r\n        hi *= 2\r\n        fhi = f(hi)\r\n        attempts += 1\r\n    if flo * fhi > 0:\r\n        # 無法找到符號改變,回傳 nan\r\n        return float('nan')\r\n    # bisection\r\n    for i in range(200):\r\n        mid = (lo + hi) / 2.0\r\n        fmid = f(mid)\r\n        if abs(fmid) < tol:\r\n            return mid\r\n        if flo * fmid < 0:\r\n            hi = mid\r\n            fhi = fmid\r\n        else:\r\n            lo = mid\r\n            flo = fmid\r\n    return (lo + hi) / 2.0\r\n\r\nresult = xirr(dates, amounts, guess=0.1)\r\n# 轉換為年化百分率\r\nif np.isfinite(result):\r\n    xirr_pct = result * 100\r\nelse:\r\n    xirr_pct = None\r\n\r\n# 嘗試找到系統中可用的中文字型以避免亂碼\r\ndef find_chinese_font():\r\n    # 常見的中文字體關鍵字\r\n    keywords = [\"Noto\", \"NotoSansCJK\", \"Source Han\", \"SimHei\", \"SimSun\", \"Microsoft YaHei\", \"Arial Unicode\", \"PingFang\", \"Heiti\", \"WenQuanYi\", \"DejaVu Sans\"]\r\n    found = []\r\n    for f in fm.findSystemFonts(fontpaths=None, fontext='ttf'):\r\n        try:\r\n            name = fm.FontProperties(fname=f).get_name()\r\n            for kw in keywords:\r\n                if kw.lower() in name.lower() or kw.lower() in f.lower():\r\n                    found.append(f)\r\n                    break\r\n        except Exception:\r\n            continue\r\n    return found[0] if found else None\r\n\r\nchinese_font = find_chinese_font()\r\nif chinese_font:\r\n    plt.rcParams['font.family'] = fm.FontProperties(fname=chinese_font).get_name()\r\nelse:\r\n    # 若找不到,仍設定為 sans-serif,matplotlib 會嘗試 fallback\r\n    plt.rcParams['font.family'] = 'sans-serif'\r\n\r\n# 繪製每月金額直方圖 (使用 bar chart 以月份為 x 軸)\r\nmonths = [d.strftime(\"%m月\") for d in dates]\r\nfig, ax = plt.subplots(figsize=(10,5))\r\nbars = ax.bar(months, amounts, color=['tab:blue' if a<0 else 'tab:orange' for a in amounts])\r\nax.set_xlabel(\"月份\", fontsize=12)\r\nax.set_ylabel(\"金額\", fontsize=12)\r\nax.set_title(\"每月現金流分佈\", fontsize=14)\r\nax.axhline(0, color='black', linewidth=0.5)\r\n# 在 bar 上顯示數值\r\nfor bar, amt in zip(bars, amounts):\r\n    height = bar.get_height()\r\n    va = 'bottom' if height >= 0 else 'top'\r\n    ax.text(bar.get_x() + bar.get_width()/2, height, f\"{amt:,.0f}\", ha='center', va=va, fontsize=9)\r\n\r\nplt.tight_layout()\r\n\r\n# 儲存圖檔\r\noutput_path = \"/mnt/data/cashflow_hist.png\"\r\nfig.savefig(output_path, dpi=150)\r\n\r\n# 列印結果與圖檔路徑\r\nprint(f\"計算完成:XIRR = {xirr_pct:.6f}%(年化)\" if xirr_pct is not None else \"XIRR 無法計算\")\r\nprint(f\"圖檔已儲存:{output_path}\")\r\n\r\n# 顯示圖形\r\nplt.show()",
      "container_id": "cntr_6a3e3cc58dcc8190b4465d8b4759ef0600d7077fd1d958bb",
      "outputs": null
    },
    {
      "id": "msg_0d2794e1ebce33f3006a3e3cdf6f8081968dd16200bed18b5c",
      "type": "message",
      "status": "completed",
      "content": [
        {
          "type": "output_text",
          "annotations": [
            {
              "type": "container_file_citation",
              "container_id": "cntr_6a3e3cc58dcc8190b4465d8b4759ef0600d7077fd1d958bb",
              "end_index": 0,
              "file_id": "cfile_6a3e3cdedd348190ad4de82b9250aec3",
              "filename": "cfile_6a3e3cdedd348190ad4de82b9250aec3.png",
              "start_index": 0
            },
            {
              "type": "container_file_citation",
              "container_id": "cntr_6a3e3cc58dcc8190b4465d8b4759ef0600d7077fd1d958bb",
              "end_index": 129,
              "file_id": "cfile_6a3e3ce0d85881908b251c6263d30862",
              "filename": "cashflow_hist.png",
              "start_index": 94
            }
          ],
          "logprobs": [],
          "text": "我已計算並繪製完畢。\n\n計算結果:\n- XIRR = 9.358533%(年化)\n\n已產生的圖檔(每月現金流分佈,x 軸:月份,y 軸:金額):\n[Download the image](sandbox:/mnt/data/cashflow_hist.png)\n\n如果你要我改成其他格式(例如 PDF 或 SVG)、改變字型、或改為累積現金流圖/折線圖,請告訴我。"
        }
      ],
      "role": "assistant"
    }
  ],
    ...略...
}annotations內會列出產生的檔案, 通常會產出多餘的圖, cfile開頭的圖可以不理它, 只要下載其餘的圖即可,
下載方式是查看annotations內資訊, 用 get method呼叫: https://你的服務名稱.azure.com/openai/v1/containers/{container id}/files/{檔案 id}/content
內容裡也有程式碼, 如果要複用, 也能把程式碼拿來在自己的電腦跑, 比較省錢
Taiwan is a country. 臺灣是我的國家