繼前一篇文章[效能監視應用]如何在AD架構中收集效能監視資料至SQL Server完成後,接下來要做什麼呢? 除了做效能的記錄以外,更重要的是要如何應用這些資訊呢?因此,它的綜合應用中,我們把目標放到設備可用度的效能監視上,在收集回來的資料中包含有LOG進來的時間,機器名稱、效能指標名稱、效能指標,透過收錄回來的資料,結合Visio的連結資料至圖示功能,將效能與網路架構圖或是機架圖...
繼前一篇文章[效能監視應用]如何在AD架構中收集效能監視資料至SQL Server完成後,接下來要做什麼呢? 除了做效能的記錄以外,更重要的是要如何應用這些資訊呢?因此,它的綜合應用中,我們把目標放到設備可用度的效能監視上,在收集回來的資料中包含有LOG進來的時間,機器名稱、效能指標名稱、效能指標,透過收錄回來的資料,結合Visio的連結資料至圖示功能,將效能與網路架構圖或是機架圖,透過結合圖示功能,除了指標資料以外,還可以再結合顏色來加強資訊的敏感層度,接下來,我們將資料整理一下,將收錄到SQL中的效能監視資料連結至Visio現有的架構圖,最後也可以透過SharePoint的Visio Service將繪製好的圖型資訊匯直接於企業內部站台中顯示,更方便管理者檢視。
SQL資料結構及目的說明
首先,我們再來了解一下效能監視器轉導到SQL的資料架構,在效能監視器轉到SQL存放時,會自動的產生三個資料表:CounterData(效能資料記錄)、CounterDetails(效能計數器資料)、DisplayToID(效能分組資料)
CounterData內的欄位說明下:
GUID: GUID for this data set. Use this key to join with the DisplayToID table.
CounterID: Identifies the counter. Use this key to join with the CounterDetails table.
RecordIndex: The sample index for a specific counter identifier and collection GUID. The value increases for each successive sample in this log file.
CounterDateTime: The time the collection was started, in UTC time.
CounterValue: The formatted value of the counter. This value may be zero for the first record if the counter requires two sample to compute a displayable value.
FirstValueA: Combine this 32-bit value with the value of FirstValueB to create the FirstValue member of PDH_RAW_COUNTER. FirstValueA contains the low order bits.
FirstValueB: Combine this 32-bit value with the value of FirstValueA to create the FirstValue member of PDH_RAW_COUNTER. FirstValueB contains the high order bits.
SecondValueA: Combine this 32-bit value with the value of SecondValueB to create the SecondValue member of PDH_RAW_COUNTER. SecondValueA contains the low order bits.
SecondValueB: Combine this 32-bit value with the value of SecondValueA to create the SecondValue member of PDH_RAW_COUNTER. SecondValueB contains the high order bits.
CounterDetails內的欄位說明如下:
CounterID: A unique identifier in the database that maps to a specific counter name text string. This field is the primary key of this table.
MachineName: The name of the computer that logged this data set.
ObjectName: The name of the performance object.
CounterName: The name of the counter.
CounterType: The counter type. For a list of counter types and their formulas, see the Counter Types section of the Windows Server 2003 Deployment Kit.
DefaultScale: The default scaling to be applied to the raw performance counter data.
InstanceName: The name of the counter instance.
InstanceIndex: The index number of the counter instance.
ParentName: Some counters are logically associated with others, and are referred to as parents. For example, the parent of a thread is a process and the parent of a logical disk driver is a physical drive. This field contains the name of the parent. Either the value in this field or the ParentObjectID field identifies a specific parent instance. If the value in this field is NULL, the value in the ParentObjectID field must be checked to identify the parent. If the values in both fields are NULL, the counter does not have a parent.
ParentObjectID: The unique identifier of the parent. The value in either this field or the ParentName field identifies a specific parent instance. If the value in this field is NULL, the value in the ParentName field must be checked to identify the parent.
DisplayToID內的欄位說明下:
GUID: Unique identifier generated for a log. This field is the primary key of this table.
RunID: Reserved for internal use.
DisplayString: Name of the log file as displayed in the System Monitor.
LogStartTime: Time the logging process started in yyyy-mm-dd hh:mm:ss:nnn format.
LogStopTime: Time the logging process stopped in yyyy-mm-dd hh:mm:ss:nnn format. Multiple log files with the same DisplayString value can be differentiated by using the value in this and the LogStartTime fields. The values in the LogStartTime and LogStopTime fields also allows the total collection time to be accessed quickly.
NumberOfRecords: Number of samples stored in the table for each log collection.
MinutesToUTC: Value used to convert the row data stored in UTC time to local time.
TimeZoneName: Name of the time zone where the data was collected. If you are collecting or have relogged data from a file collected on systems in your own time zone, this field will state the location.
以上的資料供有耐心的鄉民們啃,如果你是和Jason一樣,一秒鐘幾十萬上下(印尼盾)的話,那麼我們珍惜一下時間,我們拉幾個重點來做說明就好:
CounterID:連結CounterData及CounterDetails資料表的主鍵。
CounterData.CounterDateTime:效能記錄收錄的時間。
CounterData.CounterValue:效能記錄所收錄到的值。
CounterDetails.MachineName: 收錄效能的用戶端機器名稱
CounterDetails.ObjectName: 收錄效能的物件(分類)名稱
CounterDetails.CounterName: 收錄效能的計數器名稱
當然,做一個環境,總是要有一些假設目的,由於效能計數器是每隔15秒鐘會回傳一次所設定的效能監視資料,因此,我們將此記錄時間及效能監視單中的Processor\Processor time值拿來做為主要指標。我們假設了下列三種規範:
| 規則 | 說明 |
| 時間回應 | 超過3分鐘沒有資料回應,主機底色更換為黑色。 |
| CPU使用率 | CPU處理時間介於50~80,主機底色更換為黃色。 |
| CPU處理時間介於80~100,主機底色更換為紅色。 | |
| 標示標籤 | CPU以資料橫條來表CPU的使用率。 |
| 逾時回報的資料顯示於資料標籤上。 |
為了使資料可以符合上述的條件,我們將資料庫中的資料建立一個檢視表。
建立檢視表
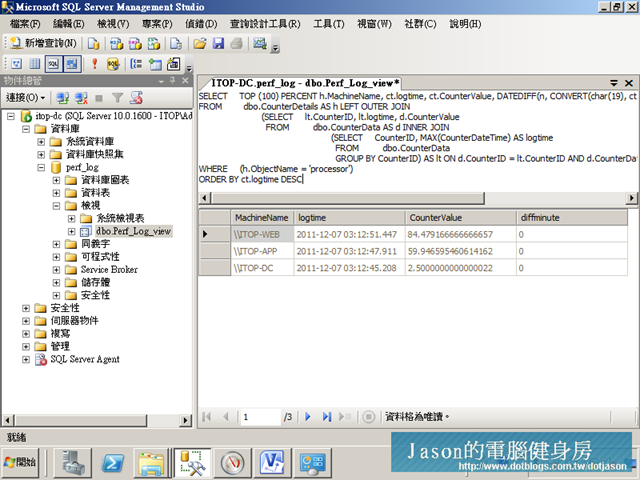
建立檢視表是希望限制存取者的所能觀看的資料,為了使資料正確的呈現,我們設定了兩個門檻,第一個門檻是View中必須將所有機器列出,不論是沒有資料值輸入的機器亦必須列出,以做為Visio連結資料時唯一視別的資料。第二個門檻則是必須將每台機器最後一筆寫入到資料庫中的資料列出來,並且所有資料都只呈現一筆。為使達成這個目的,Jason土法煉鋼透過子查詢+Join寫出這個View:
SELECT  h.MachineName, ct.logtime, ct.CounterValue, DATEDIFF(n, CONVERT(char(19), ct.logtime, 120), GETDATE()) AS diffminute
FROM         dbo.CounterDetails AS h LEFT OUTER JOIN
      (SELECT     lt.CounterID, lt.logtime, d.CounterValue
       FROM          dbo.CounterData AS d INNER JOIN
             (SELECT     CounterID, MAX(CounterDateTime) AS logtime
              FROM          dbo.CounterData
              GROUP BY CounterID) AS lt ON d.CounterID = lt.CounterID AND d.CounterDateTime = lt.logtime) AS ct ON ct.CounterID = h.CounterID
WHERE     (h.ObjectName = 'processor')
ORDER BY ct.logtime DESC
最內圈的子查詢是列出最後一筆資料時間與主要ID,第二圈的子查詢則是將時間與最後一筆的效能計數資料拉出,最後就是列出所有電腦名稱,並且將現在的時間算出與資料庫中的記錄時間間隔多少分鐘,完成之後,我們就可以得到下面的畫面:(共收集到三台電腦的資料,並且是以Processor做過濾條件,找到最後一筆回應時間及效能資料。)
連結資料
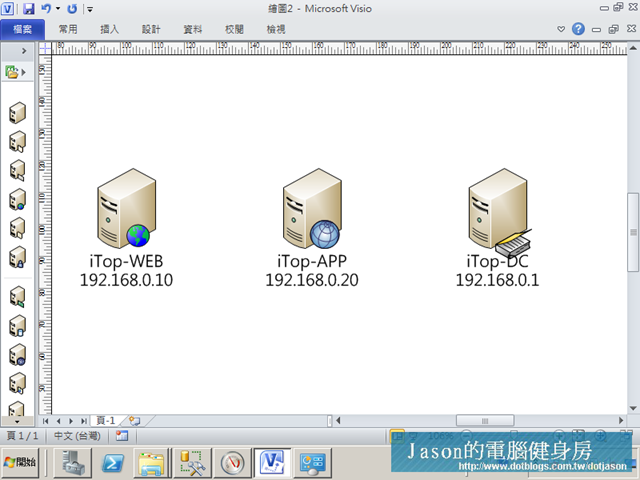
接下來,我們在Visio中,依照我們所建立出來的資料,拉出三種不同的icon表示不同的主機
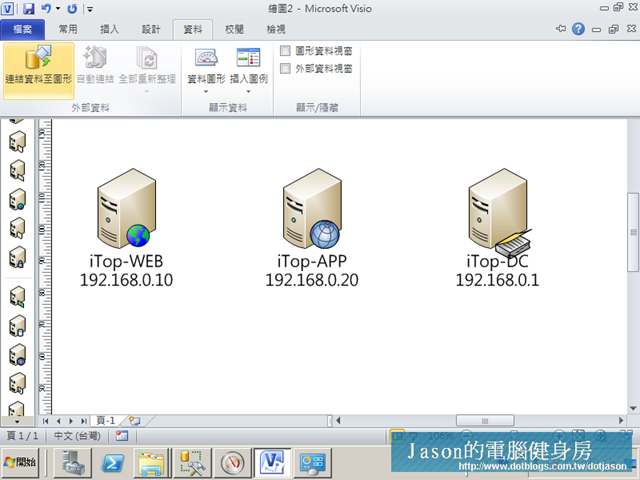
接下來點下資料頁籤再點選『連結資料至圖型』功能按鈕。
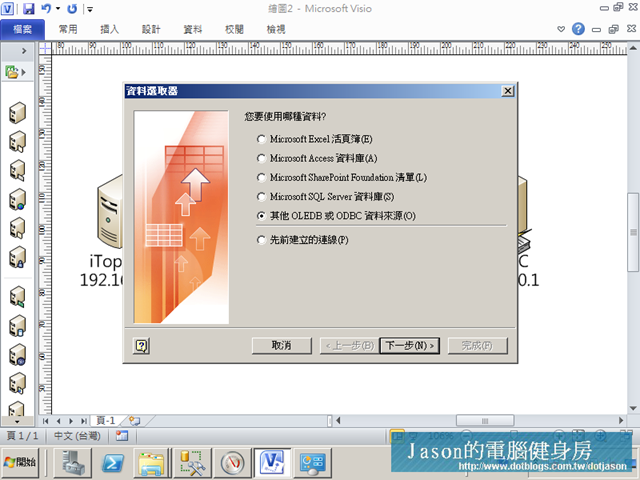
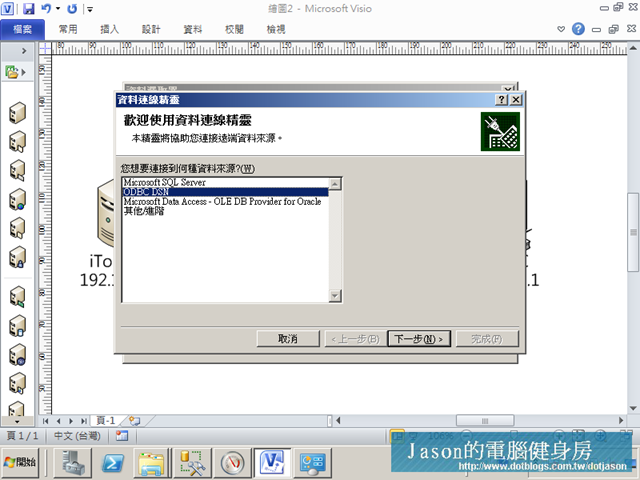
選擇『其它OLEDB或ODBC資料來源』
直接選擇ODBC DSN。
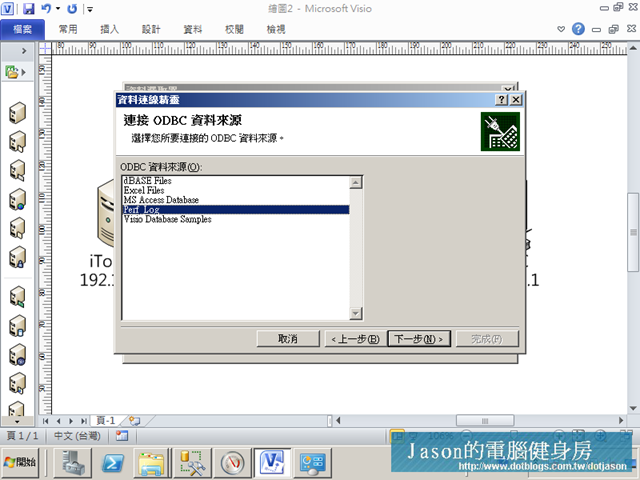
在系統中已經有建立了不少的ODBC連線資料,在此選擇我們自已建立的Perf_Log。
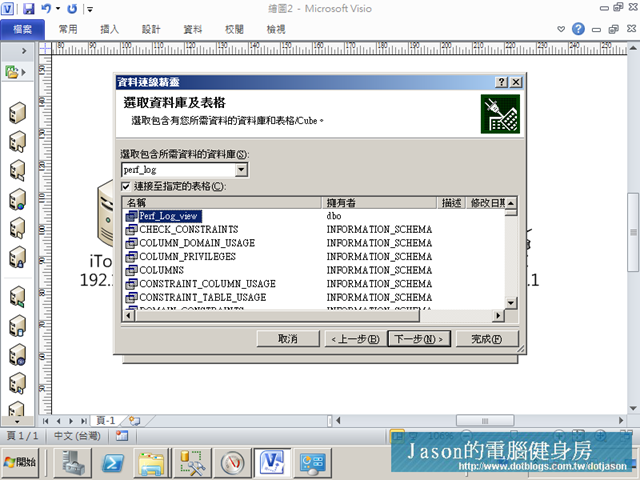
為了讓我們方便,已經有建立了一個View,我將它命名為Perf_Log_View。
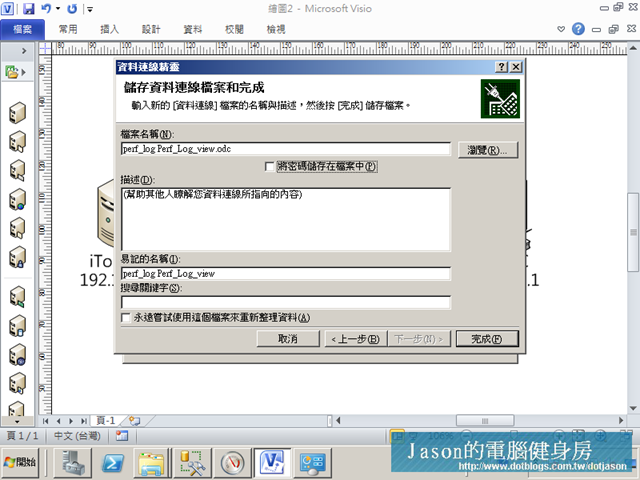
接下來輸入一個好記的名稱,Jason直接按下一步。
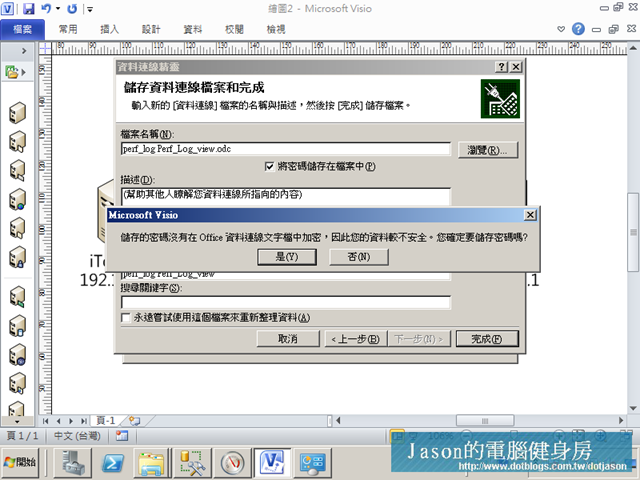
接下來因為我們必須讓SQL執行原有的驗證方式,在此設定將密碼儲存檔案中。
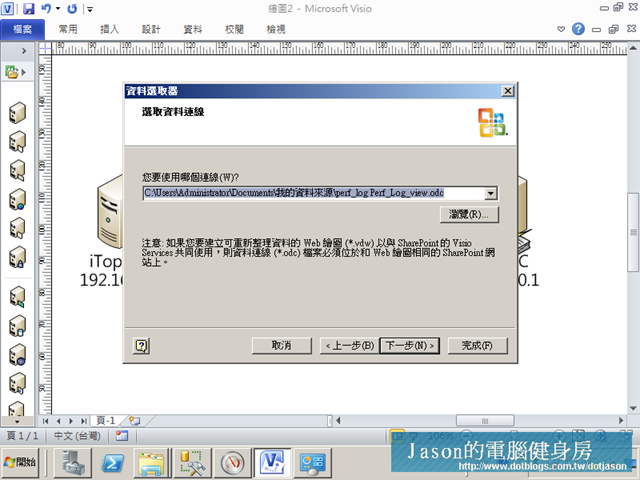
完成後,再次確認路徑。
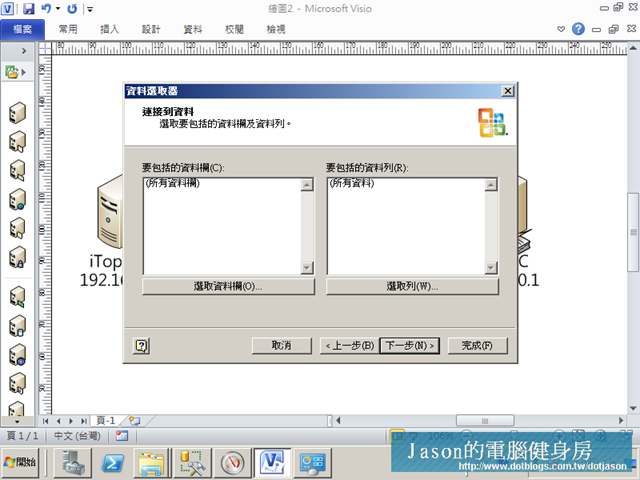
接下來在資料集的部份,直接點選下一步。
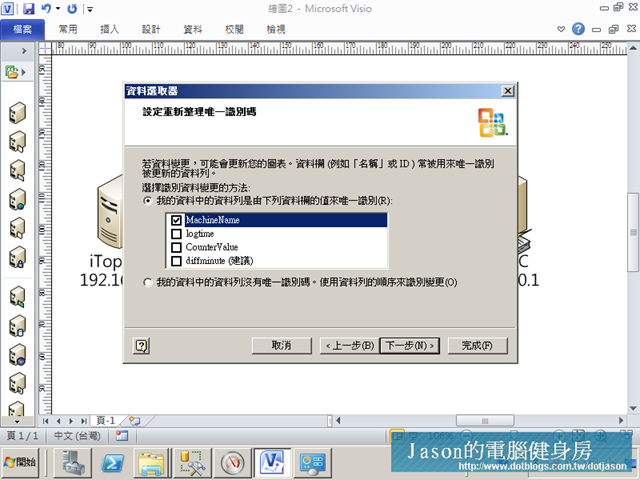
預設值是DIFFMINUTE,Jason將它改變成為機器名稱會比較沒有衝突,建議將工作分散 。
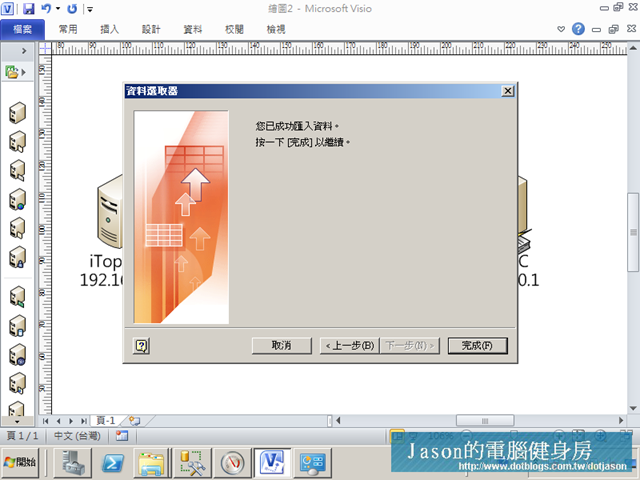
完成後點選下一步就會看到了!
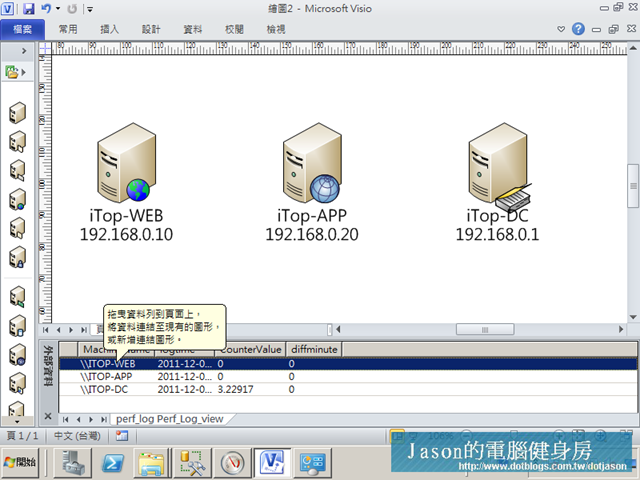
此時我們看下面有三筆以內部電腦名稱資料被列出來,接下來就必須把圖型和資料的連結連結好
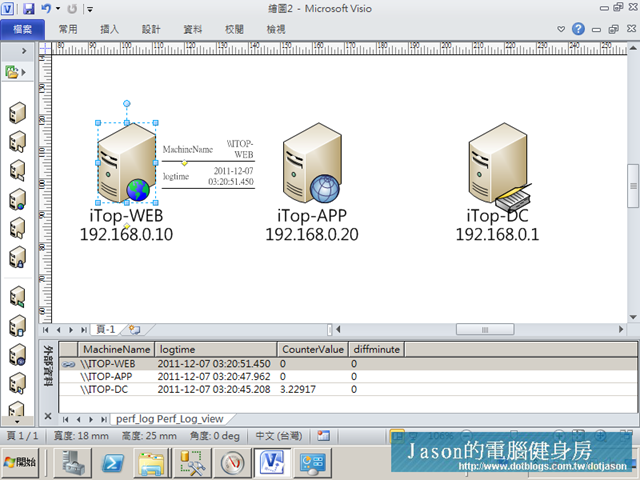
連結好了如同下圖所示:
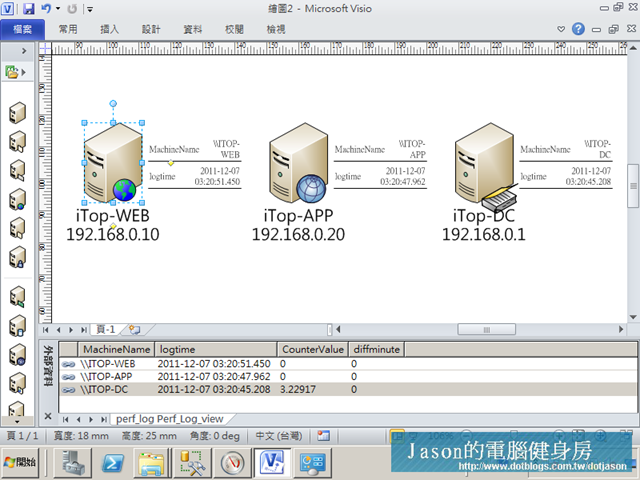
接下來一一連起來,即完成本部份的目的。
設定醒目資訊
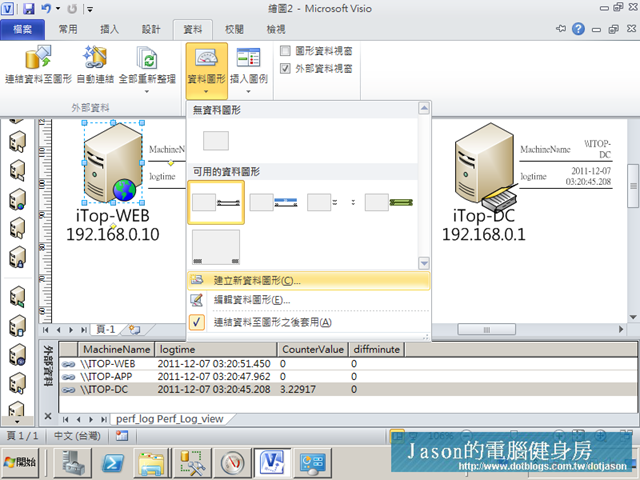
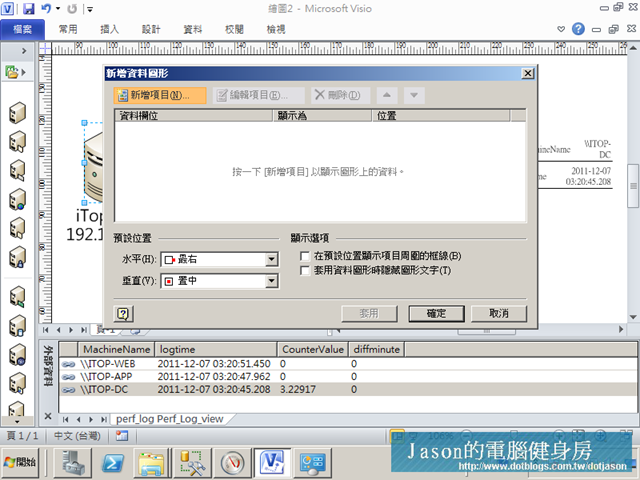
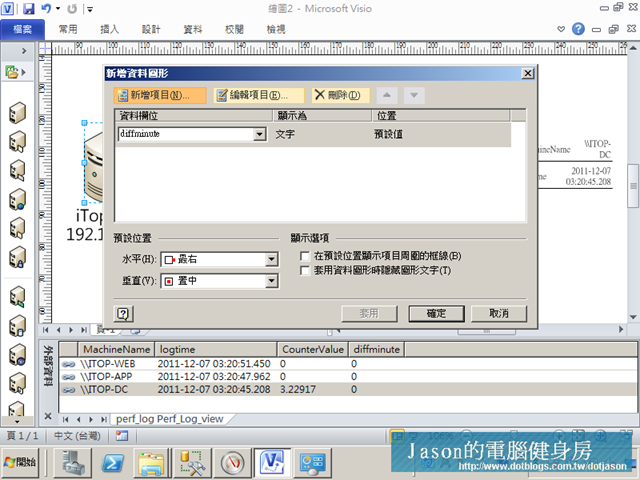
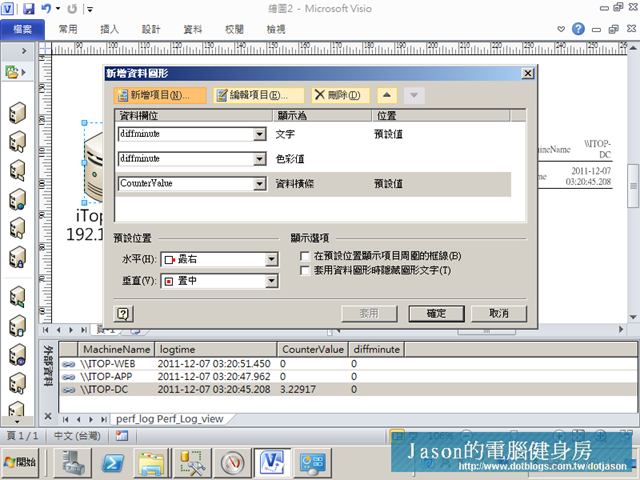
首先點選一台設備,並指定新的資料圖型(資料->資料圖形->新增新資料圖型。)
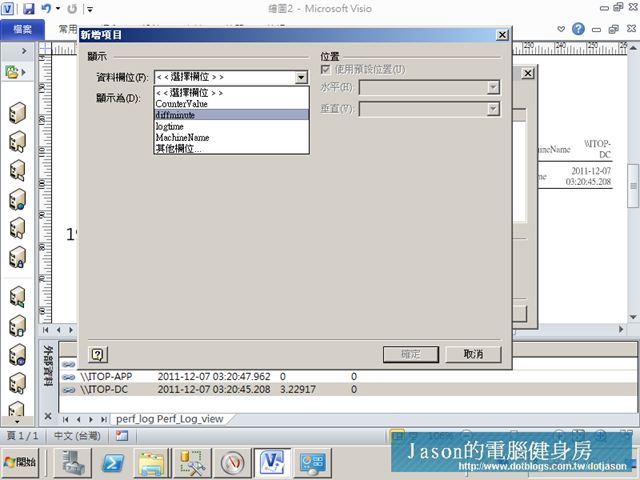
接下來點選新增項目。
將資料面位改變成為Dirffminmute。
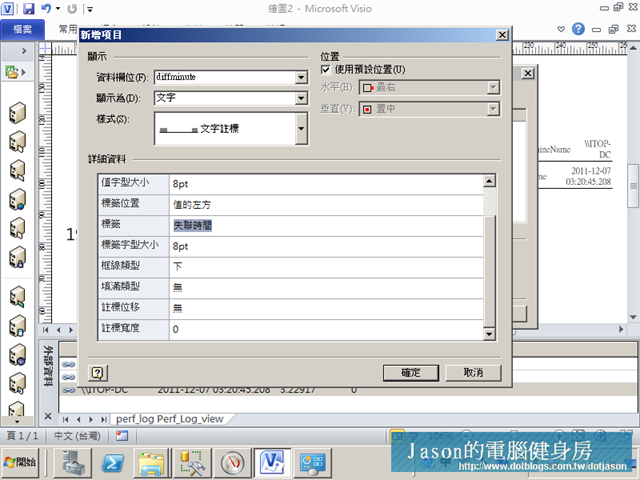
選擇顯示為『文字』、文字註標,最後為了讓使用者可用到,因此在標歲處輸入『失聯時間』。
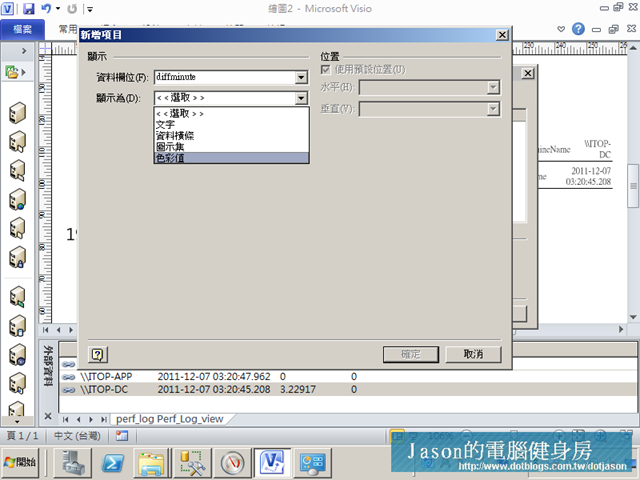
完成後接著,將填色也考量進來。
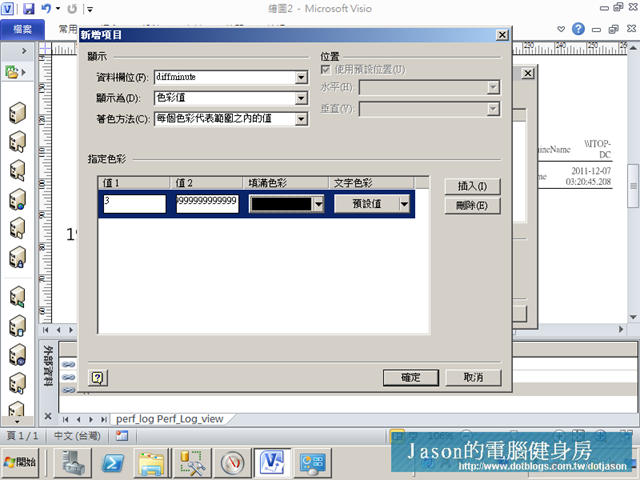
這次選擇Diffminute並且選擇色彩組,以做為當機時超過三分鐘沒有將效能資料推到管理者畫面中呈現黑色底圖。
因此,在值1設定為3分鐘,另一個值則是999999999,n個九。
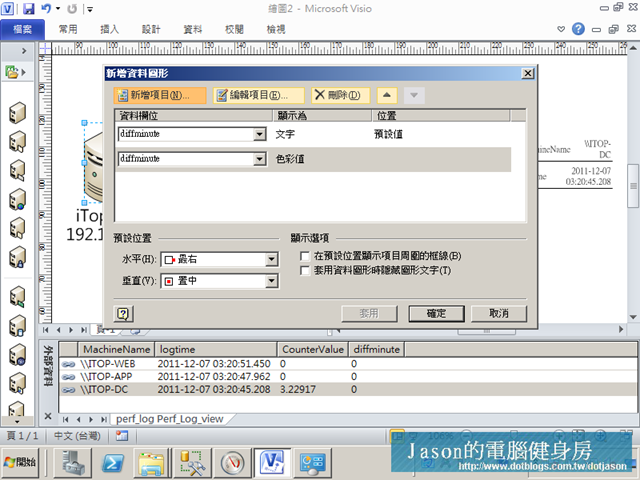
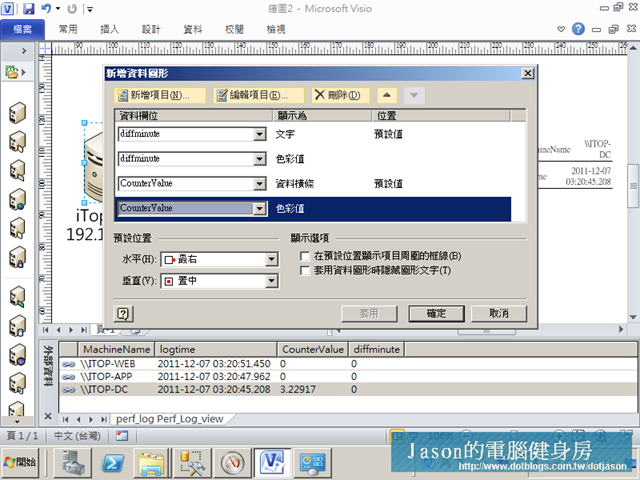
完成後,再新增項目
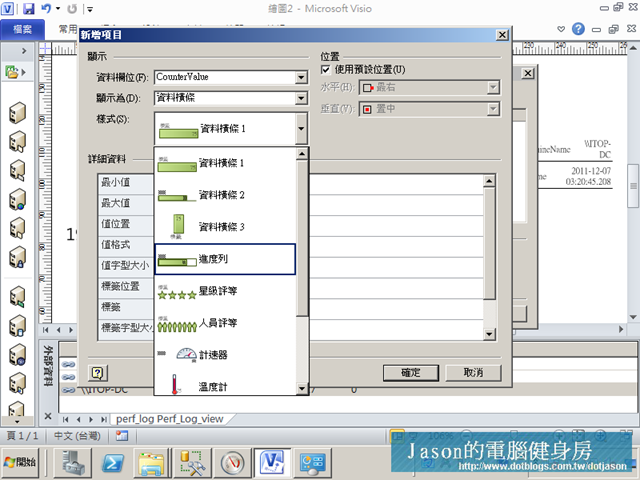
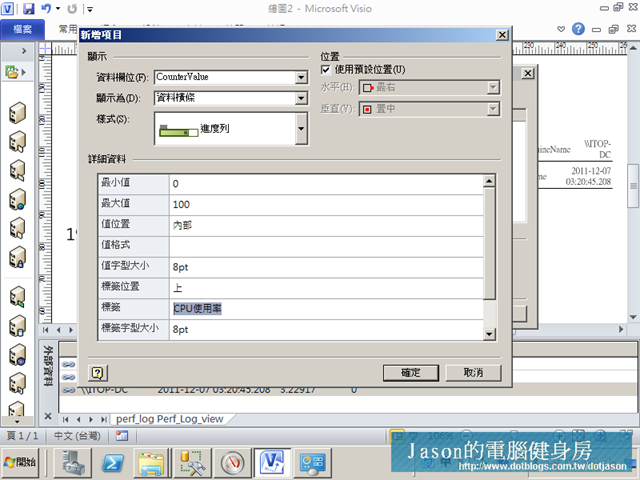
這次以CounterValue來達成CPU的示意
並修改標簽,指定一個看得懂的。
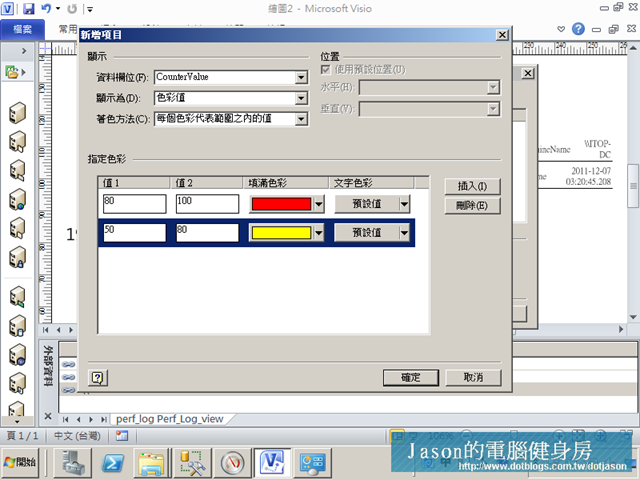
接下來再完成CPU要求的顏色區域
相同,為了滿跑80~100要顯示成紅色那個顏色,50~80為黃色。
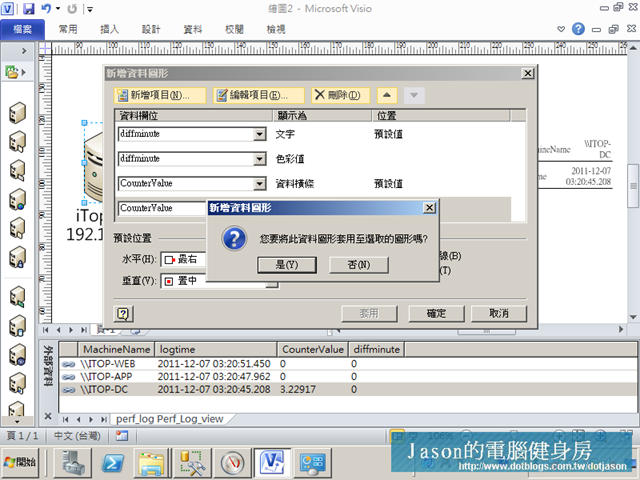
完成後,接下來就直接存檔
它會詢問你是否要套用。
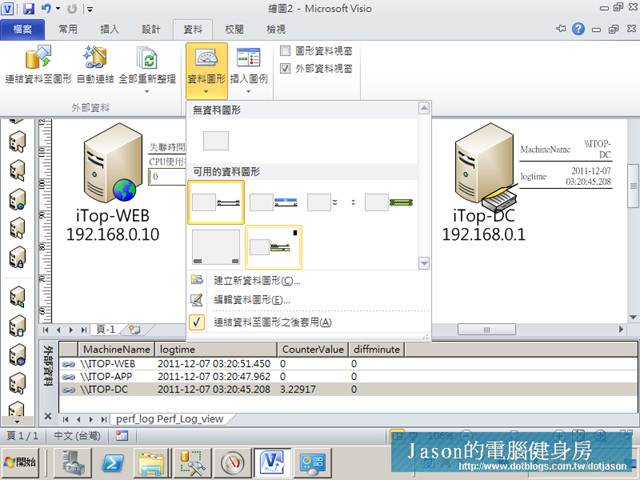
接下來將所有的設備更換成為新建立的資料圖形
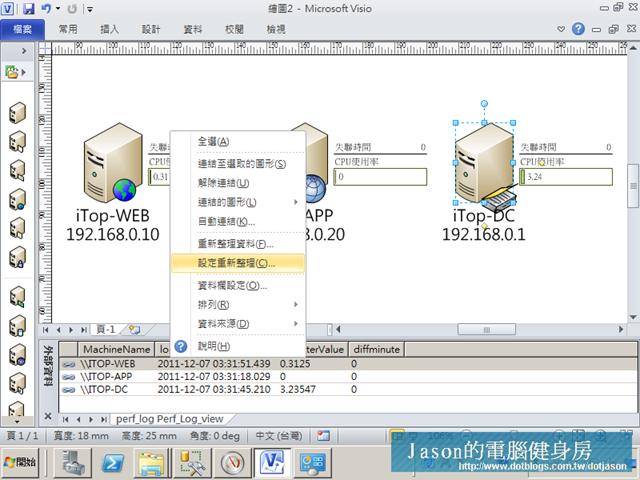
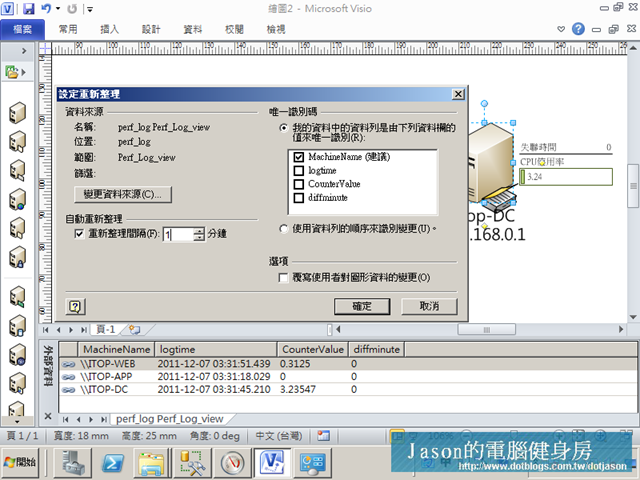
接下來,我們必須讓它可以自動重新整理,因此在資料列上按右鍵,即有一個設定重新整點,我們指定成為1分鐘/
成果
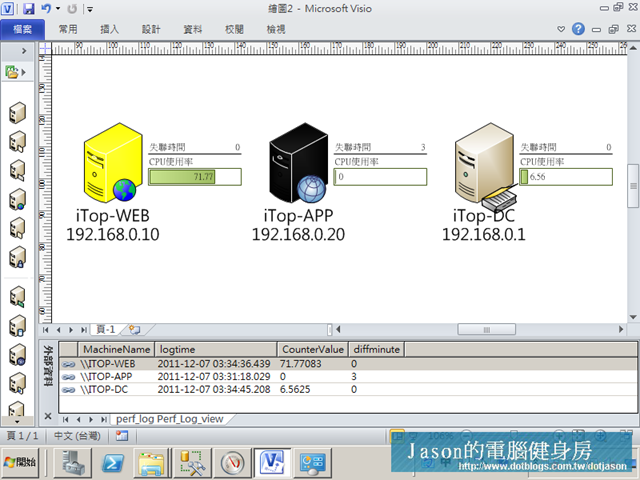
呼~~!展示的成果如下所示,如以將iTop-APP失聯時間超過3分鐘了,錢也花在刀口上,這個案例是Jason另一位夥伴討論出來,其中包含了很多的瓶頸,希望大家看到這個題目可以有更多的議題產生!
下圖表示為iTop-Web 使用超過60%的CPU,顏色被改成黃色,但是離線超過三分鐘的,則是自動補滿成為黑色即可。
參考資料:
新增匯入的資料到圖形 http://office.microsoft.com/zh-tw/visio-help/HA010131383.aspx
一點通 - 如何連結多個異質性的外部資料至 Visio 圖形 http://support.microsoft.com/kb/981220/zh-tw
特別感謝:
特別感謝王仲麒老師指導資料收集及連結Visio之相關問題,再次感謝!
王仲麒老師個人部落格 http://www.dotblogs.com.tw/areswang/
Anything keeps Availability.
Anywhere keeps Integrity.
Anytime keeps Confidentiality.
keep A.I.C. = Information Security
