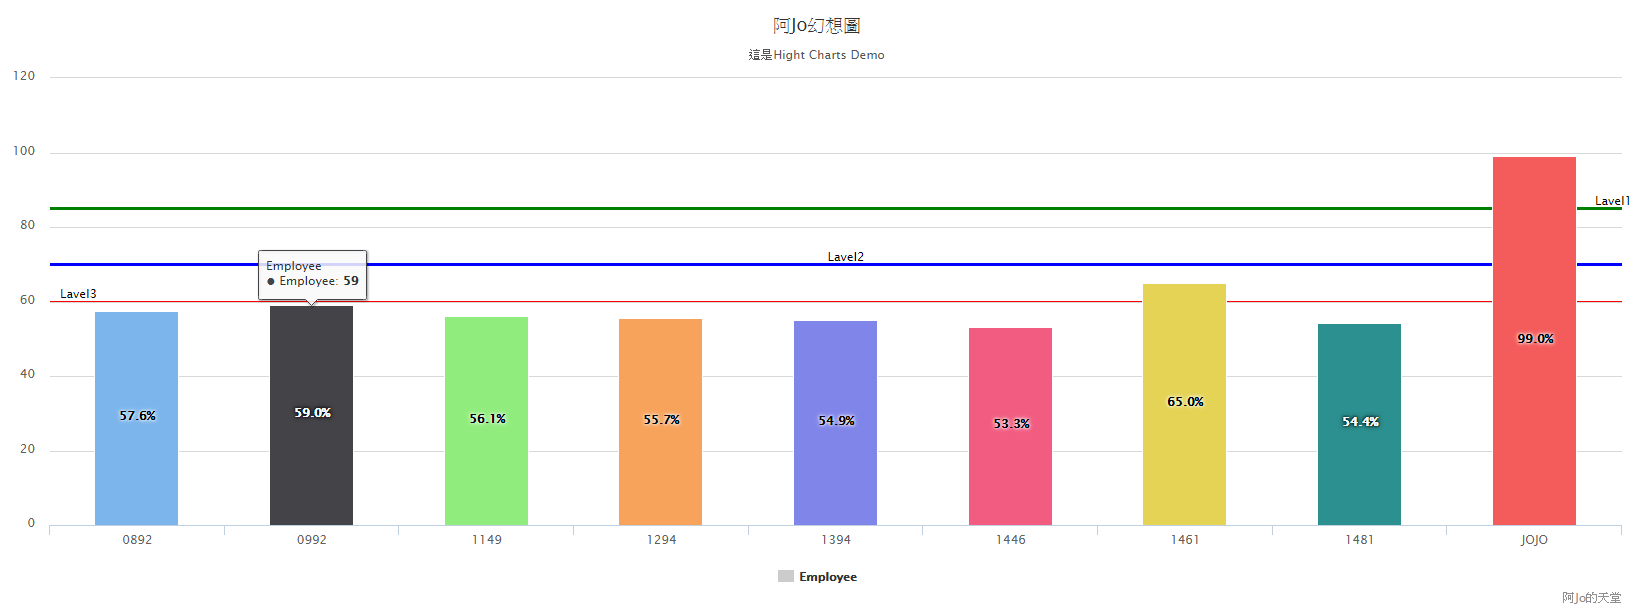
最近測試Fusion Charts及High Charts繪製圖表,暫決定由High chart擔任,繪製沒問題就替換資料來源。
測試資料由R提供資料陣列。。。由Laravel向R索取資料
再讓High Charts進行繪圖
把R的Script先暫時存放在Resource下的R目錄,叫test.R,因為要呼叫R,若是在Windows底下,一定要記得設環境變數
不要像我,沒設RScript環境變數,搞了半天
Laravel code大同小異,Controler部份,重點在exec後面的$response是接回傳的資料,R部份要cat
    public function ListAll(Request $request) {

          exec("Rscript ".resource_path()."\\R\\Test.R  $level1 $level2", $response);

          $data = json_decode($response[0]);

          return view($this->localview.'.List',compact('level3','level1','level2'))
                    ->with('data',$data );
    }
test.R的程式
library(rjson)

args <-commandArgs(TRUE)
mylist<-strsplit(args," ")
myData<-function() {
  result<-list();
  result[["0892"]]<-57.56;
  result[["0992"]]<-59;
  result[["1149"]]<-56.05;
  result[["1294"]]<-55.67;
  result[["1394"]]<-54.92;
  result[["1446"]]<-53.25;
  result[["1461"]]<-65.02;
  result[["1481"]]<-54.35;
  result[["JOJO"]]<-99
  return(result)
}


result<-myData()


cat(toJSON(result))
當Controller順利取得R資料部份,就是view部份了,和之前的其實都不用改,因為Controller給的資料都一樣,只是一個由Laravle自行取得,一個由R來..
@extends('layouts.app')
    @section('HitsGlobal')
        @parent

    @endsection

    @section('content')
      <div id="container" style="width:100%; height:600px;">

      </div>

    @stop
    @section('HitsLoadScript')
        @parent
        <script type="text/javascript" src="{{ URL::asset('js/HighCharts/highcharts.js') }}"></script>
        <script type="text/javascript" src="{{ URL::asset('js/HighCharts/exporting.js') }}"></script>

    @endsection
    @section('HitsScript')
        @parent
        <!-- 另一個做法-->
        //var options={
        //      char:{},
        //      title: {}
        // }
        //$('#container').highcharts(options);
        $(function () {
            $('#container').highcharts({
                chart: {
                    type: 'column'
                },
                title: {
                    text: '阿Jo幻想圖'
                },
                subtitle: {
                    text:'這是Hight Charts Demo',
                },
                xAxis: {
                    type: 'category'
                },
                yAxis: {
                    title:'aaa',
                    plotLines:[
                            {
                                value:85,
                                color:'green',
                                dashStyle:'Sold',  //shortdash虛線
                                width:3,
                                label: {
                                    text:'Lavel1',
                                    align:'right',
                                    },
                            },
                            {
                                value:70,
                                color:'blue',
                                dashStyle:'Sold',
                                width:3,
                                label: {
                                    text:'Lavel2',
                                    align:'center',
                                    },
                            },
                            {
                                value:60,
                                color:'red',
                                dashStyle:'Sold',
                                width:2,
                                label: {
                                    text:'Lavel3',
                                    align:'left',
                                    },
                            }
                        ]
                },
                credits: {
                    enabled: true,
                    text:'阿Jo的天堂',
                    href:'https://dotblogs.com.tw/jojo',

                },
                legend:{
                    enabled:true,
                },
                tooltip: {
                            headerFormat: '<span style="font-size:11px">{series.name}</span><br>',

                        },
                <!-- Test -->
                plotOptions: {
                    series: {
                        borderWidth:1,
                        allowPointSelect: true,
                        dataLabels: {
                            enabled: true,
                            format: '{point.y:.1f}%',
                            inside:true
                        },
                        //events: {
                        //    click: function (event) {
                        //        window.location='{eventpoint.x:}';
                        //    }
                        //},
                    }

                },
                <!-- End Test -->
                series: [
                    {
                        name:'Employee',
                        colorByPoint :true,
                        data:[
                        <?php
                            foreach($data as $key=>$value) {
                                $scriptattr ='{'
                                        . 'name:"'.$key.'"'
                                        . ',y:'.$value.''
                                        . ",events: { click: function(event) { window.location='". URL::asset('Charts/HighCharts/List1/').'/'.$key. "'}}"
                                        . ' },';

                                echo $scriptattr;
                            }
                        ?>
                        ],
                    },


                ]
            });
        });
    @endsection
結果

打雜打久了,就變成打雜妹
程式寫久了,就變成老乞丐