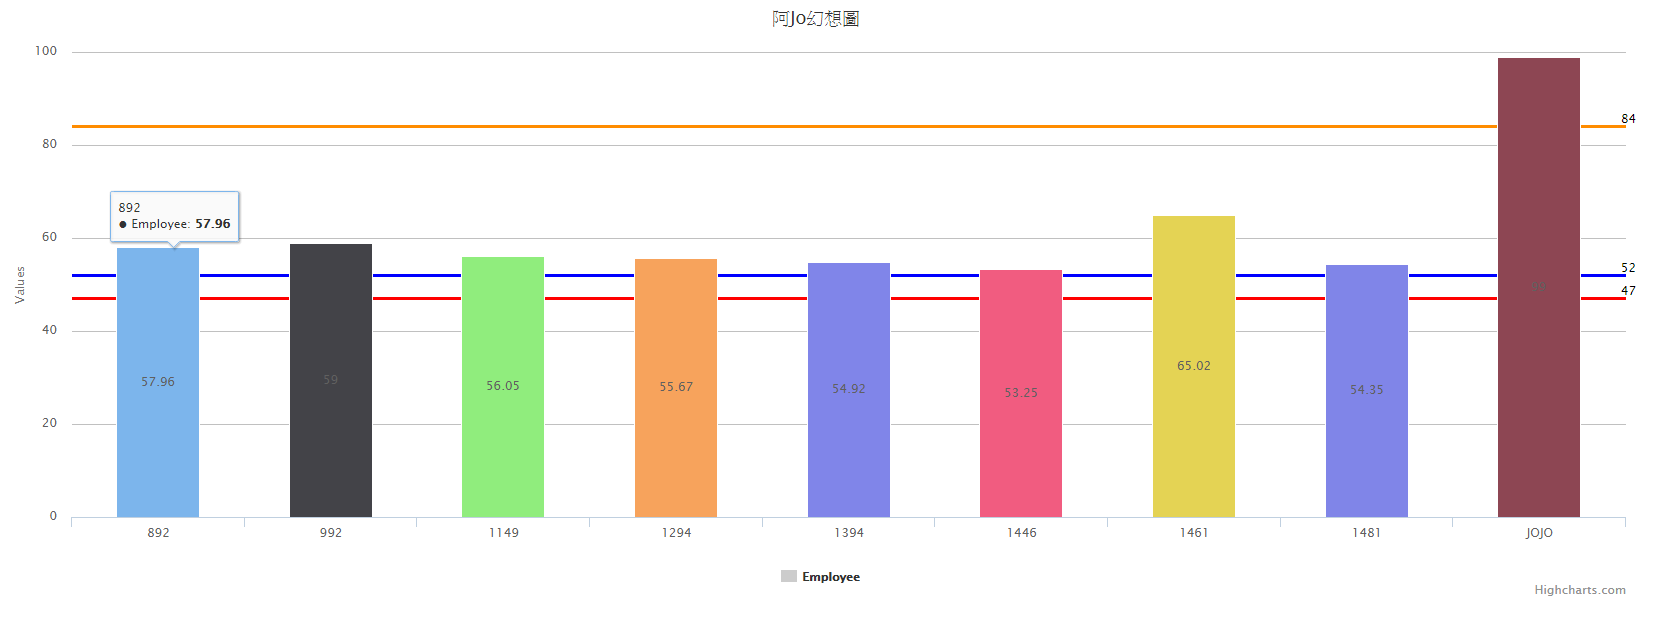
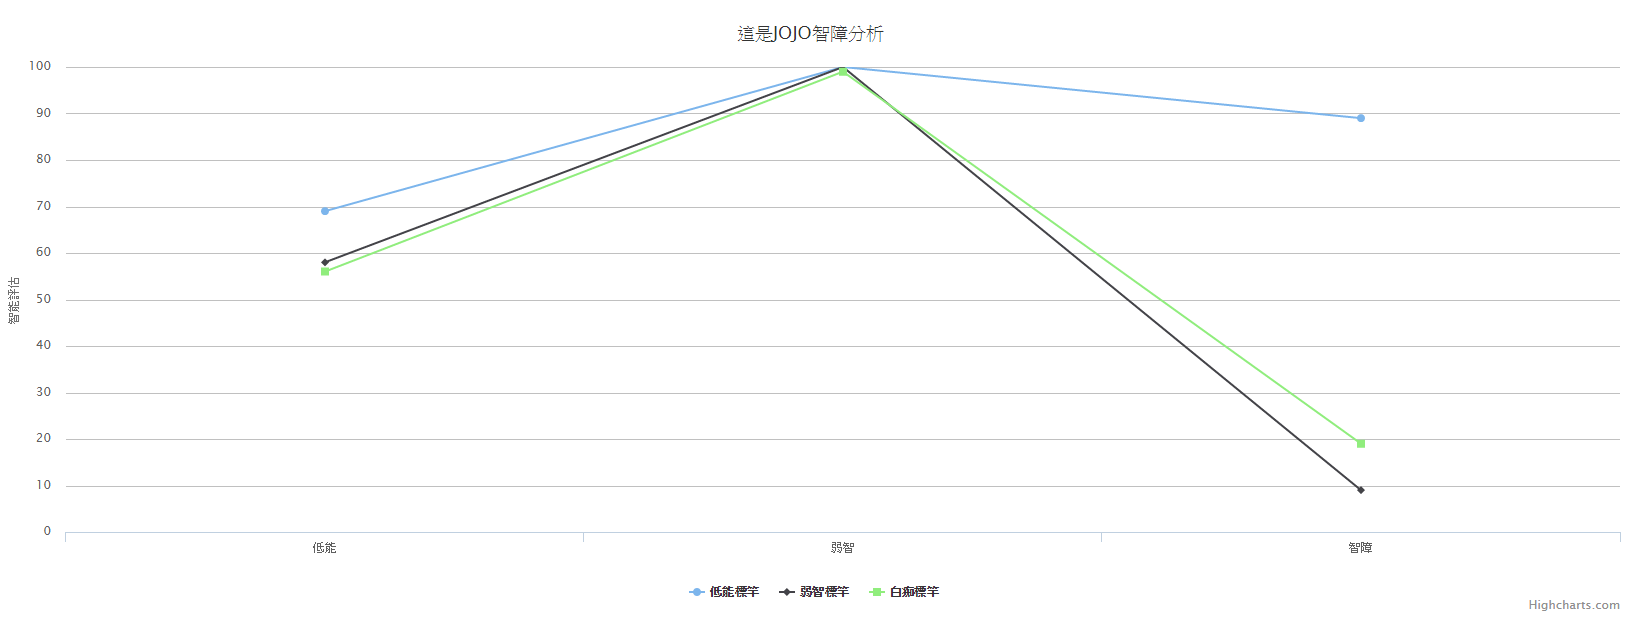
前陣子在Laravel上畫Highcharts圖,這次把一模一樣的圖改在asp.net上畫一次,覺得DotNet.Highcharts真是好用套件,畫出來長的和之前在Laravel上畫的差不多吧


接下來就快著手筆記,免得一下忘的一乾二淨
1.請先用Nuget安裝DotNet.Highcharts套件,安裝時,會一併安裝highcharts套件,請記住,Highcharts套件在商業用時,是要錢喔
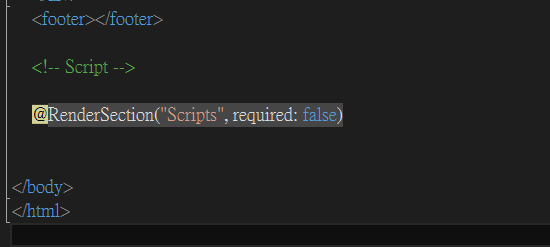
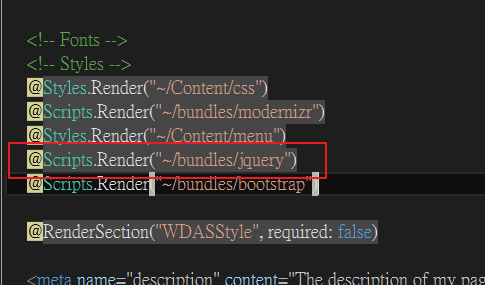
裝完後,如果發生圖都出不來時,且有JQeury錯誤訊息,請把Layout的JQuery往前提
 原本Jquery放在footer下,但因為載入順序問題,把它往前提了


2.開始將要呈現的圖利用DotNet.highcharts套件進行組裝囉,Demo code是放在Services的專案裡
這套件挺方便的,反正知道Highcharts的js怎麼用,只要把它放到一樣的地方,記得回傳Highcharts即可,所以。。。只要專注寫C#即可,不要去管js套件了。。。
這套件寫的人真是佛心來滴~~好啦。。。資料處理完,接著看Controller怎麼處理囉
       public Highcharts BarCharts(string containerName,string weburl)
        {
            List<KeyValueViewModel> datasource1 = new List<KeyValueViewModel>();
            datasource1.Add(new KeyValueViewModel() { key = "0892", value = 57.96 });
            datasource1.Add(new KeyValueViewModel() { key = "0992", value = 59 });
            datasource1.Add(new KeyValueViewModel() { key = "1149", value = 56.05 });
            datasource1.Add(new KeyValueViewModel() { key = "1294", value = 55.67 });
            datasource1.Add(new KeyValueViewModel() { key = "1394", value = 54.92 });
            datasource1.Add(new KeyValueViewModel() { key = "1446", value = 53.25 });
            datasource1.Add(new KeyValueViewModel() { key = "1461", value = 65.02 });
            datasource1.Add(new KeyValueViewModel() { key = "1481", value = 54.35 });
            datasource1.Add(new KeyValueViewModel() { key = "JOJO", value = 99 });

            //=======================================================
            //Data部份,可有多個SeriesData
            List<SeriesData> seriesdata1 = new List<SeriesData>();

            foreach (var data in datasource1)
            {
                SeriesDataEvents myevents = new SeriesDataEvents();
                myevents.Click = "function(event) { "
                    + "  window.location='" + weburl + "/" + data.key + "'; "
                    + "} ";

                seriesdata1.Add(new SeriesData()
                {
                    Name = data.key,
                    Y = data.value,
                    Events = myevents,
                });
            }

            //=======================================================
            //標題/副標
            var title = new Title() { Text = "阿Jo幻想圖", Align = HorizontalAligns.Center };
            var subtitle = new Subtitle() { Text = "這是HighCharts Demo" };
            //========================================================
            //可有多組Series
            //SeriesData引進Series
            List<Series> seriesList = new List<Series>();
            Series series1 = new Series();
            series1.Data = new Data(seriesdata1.ToArray());
            series1.Name = "Employee";


            seriesList.Add(series1);
           // seriesList.Add(series2);
            //================================================================
            //plopOptions區
            var ploption = new PlotOptions();
            PlotOptionsSeriesDataLabels lab = new PlotOptionsSeriesDataLabels()
                {
                    Enabled = true,
                    Inside = true,
                };
            ploption.Series = new PlotOptionsSeries() { LineWidth = 5, DataLabels = lab, AllowPointSelect = true };
            ploption.Column = new PlotOptionsColumn() { ColorByPoint = true,};   //ColorByPoint為Ture為自動設定資料色系
            //-------------------------------------------------------------------------------------------------
            // yAxis區域
            int[] templevel = { 47, 52, 84 };
            Color[] linecolor = { Color.Red, Color.Blue, Color.DarkOrange,Color.BlueViolet,Color.Cyan };
            List<YAxisPlotLines> yaxisplotlines = new List<YAxisPlotLines>();
            int j = 0;
            foreach (var i in templevel) {
                yaxisplotlines.Add(new YAxisPlotLines()
                {

                    Value = i,
                    DashStyle=DashStyles.Solid,
                    Label = new YAxisPlotLinesLabel()
                            {
                                Text = i.ToString(),
                                Align=HorizontalAligns.Right,
                            },
                    Color = linecolor[j%5],
                    Width = 3
                });
                j++;
            }

            var yAxis = new YAxis();
            yAxis.Min = 0;
            yAxis.Max = 100;
            yAxis.PlotLines = yaxisplotlines.ToArray();

            //===================================================================
            //xAxis區域
            XAxis xaxis = new XAxis();
            xaxis.Type = AxisTypes.Category;
            //===================================================================
            //
            Legend legend = new Legend();
            legend.Enabled = true;
            //===================================================================
            Tooltip tooltip = new Tooltip();
            tooltip.HeaderFormat = @"< span style = 'font-size:16px' >JOJO{ series.name}</ span >< br >";

             //===================================================================
             //進行Higcharts組裝

             var mycharts = new Highcharts(containerName);

            mycharts.InitChart(new Chart() { Type= ChartTypes.Column, Height = 600 })
                .SetTitle(title)
                .SetLegend(legend)
                .SetSeries(seriesList.ToArray())
                .SetPlotOptions(ploption)
                .SetYAxis(yAxis)
                .SetXAxis(xaxis);
            return mycharts;
        }
3.Controller好像只要去呼叫Services就好,沒什麼特殊
Code裡面傳的JoJo是要告訴Highcharts要呈現的圖,div的id名稱,會自動建一個JOJO_container的div出來,所以也不用手動建div了
Controller完了,就剩view了,View更好,只要一行。。。。。
        public ActionResult GetDemo1() {
            string weburl = Url.Action("Demo2", "HighCharts");
            Highcharts wdascharts = _services.BarCharts("JOJO",weburl);
            return View(wdascharts);
        }
4.View除了一開始用@model外,看你@Model擺那。。。charts就出來囉,當然啦,Highcharts套件引用是必然的,懶一點就再做一個Highcharts專用的Layout來用囉,這樣圖就會出來囉
@using Demo.Models.ViewModels.HighCharts;
@model DotNet.Highcharts.Highcharts
@using Demo.Models.ViewModels.HighCharts;
@model DotNet.Highcharts.Highcharts

@{
    ViewBag.Title = "GetDemo1";
}


<div style="width:100%; height:100%;">@Model</div>
@section scripts {
    @Scripts.Render("~/bundles/HighCharts")
}
打雜打久了,就變成打雜妹
程式寫久了,就變成老乞丐