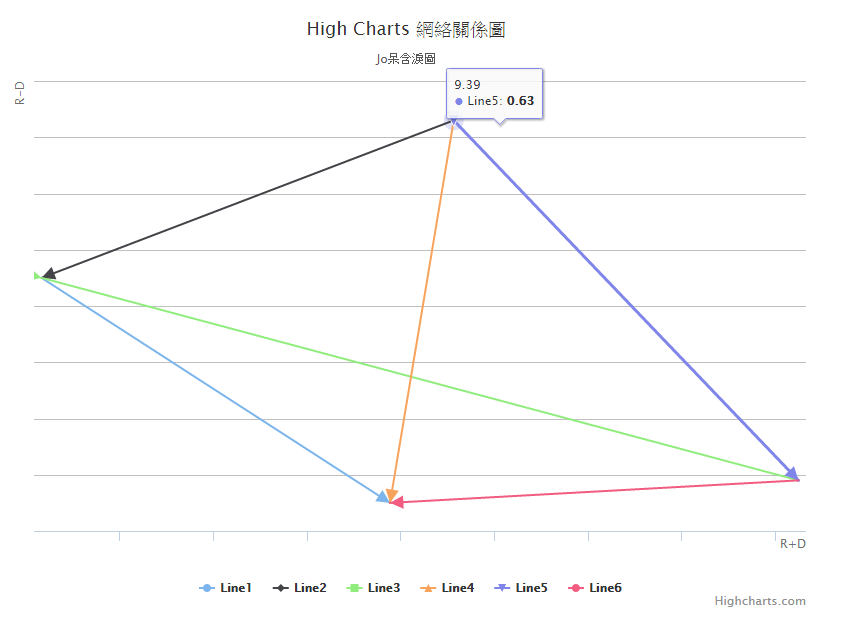
和之前在Laravel上測試畫出一樣的圖,改到asp.Net 上畫,引用DotNet.Highcharts套件,小卡了一下,原本組Script組的出來,但用套件,要找到可以適用的方法
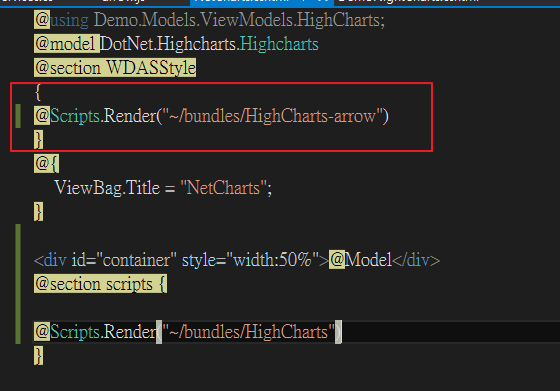
還有額外配置畫箭頭的函數位置要那到View前頭,否則會發生script error

趕緊著手筆記,首先可以去網路找,有神人將箭頭Script寫出來了,但。。。出處是那裡,小的回頭就找不到了。。。。
1. 附上js相關code如下,我將它定成arrow.js,將此scipt引用至View,請將它置於頁面前端,因為產生順序,若置於頁尾,會出現scritp error

        $(function () {
            var lineSeries = Highcharts.seriesTypes.line;


            Highcharts.Renderer.prototype.symbols.arrow = function (x, y, w, h, options) {
                var angle;
                angle = options.angle; // angle for arrow
                w = w / 1.2;
                x = x + h / 2 - 2 * w * Math.sin(angle);
                y = y + h / 2 - 2 * w * Math.cos(angle);
                h = w * 2;
                return ['M', x, y,
                        'L', x + w * Math.cos(angle), y - w * Math.sin(angle),
                        x + h * Math.sin(angle), y + h * Math.cos(angle),
                        x - w * Math.cos(angle), y + w * Math.sin(angle),
                        'Z'];

            };
            Highcharts.Renderer.prototype.symbols.Leftarrow = function (x, y, w, h, options) {
                var angle;
                angle = options.angle; // angle for arrow
                w = w / 1.2;
                x = x + h / 2 - 2 * w * Math.sin(angle);
                y = y + h / 2 - 2 * w * Math.cos(angle);
                h = w * 2;
                return ['M', x, y,
                        'L', x + w * Math.cos(angle), y - w * Math.sin(angle),
                        x - w * Math.cos(angle), y + w * Math.sin(angle),
                        x + h * Math.sin(angle), y + h * Math.cos(angle),

                        'Z'];

            };

            Highcharts.Series.prototype.drawPoints = function () {
                // re-define Highcharts globals
                var UNDEFINED,
                    NORMAL_STATE = '',
                    SELECT_STATE = 'select';
                var series = this,
                    pointAttr,
                    points = series.points,
                    chart = series.chart,
                    plotX,
                    plotY,
                    i,
                    l,
                    point,
                    radius,
                    symbol,
                    isImage,
                    theta,
                    lastPoint,
                    thisPoint,
                    graphic;
                if (series.options.marker.enabled) {
                    i = points.length;
                    l = i;
                    while (i--) {
                        point = points[i];
                        plotX = point.plotX;
                        plotY = point.plotY;
                        graphic = point.graphic;
                        // only draw the point if y is defined
                        if (plotY !== UNDEFINED && !isNaN(plotY)) {
                            if (i > 0) { // orient the arrow in the forward direction
                                lastPoint = points[i - 1];
                                thisPoint = points[i];
                                theta = Math.atan((plotX - lastPoint.plotX) / (plotY - lastPoint.plotY));
                                if (theta <= 0 && thisPoint.plotY < lastPoint.plotY) { // adjust if angle is negative even though series is moving up
                                    theta = theta + Math.PI;
                                }
                            }
                            else if (l > 1) { // orient the arrow in the backwards direction
                                lastPoint = points[i];
                                thisPoint = points[i + 1];
                                theta = Math.atan((thisPoint.plotX - lastPoint.plotX) / (thisPoint.plotY - lastPoint.plotY));
                            }
                            else { // orient the arrow upwards
                                lastPoint = points[i];
                                thisPoint = points[i];
                                theta = 0;
                            }
                            pointAttr = point.pointAttr[point.selected ? SELECT_STATE : NORMAL_STATE];
                            radius = pointAttr.r;
                            symbol = Highcharts.pick(point.marker && point.marker.symbol, series.symbol);
                            isImage = symbol.indexOf('url') === 0;
                            if (graphic && !(symbol === 'arrow')) { // update by translation. arrows must be re-rendered for angle
                                graphic.animate({ x: plotX - radius, y: plotY - radius, width: 2 * radius, height: 2 * radius });
                            }
                            else if (graphic && !(symbol === 'Leftarrow')) { // update by translation. arrows must be re-rendered for angle
                                graphic.animate({ x: plotX - radius, y: plotY - radius, width: 2 * radius, height: 2 * radius });
                            }
                            else if (radius > 0 || isImage) {
                                if (point.graphicElement) { // destroy the old marker
                                    point.graphicElement.destroy();
                                }
                                point.graphicElement = chart.renderer.symbol(
                                        symbol,
                                        plotX - radius,
                                        plotY - radius,
                                        2 * radius,
                                        2 * radius,
                                        { angle: theta }).attr(pointAttr);
                                point.graphic = point.graphicElement.add(series.group);
                            }
                        }
                    }
                }
            };
            (Highcharts);
        });
2.處理資料,主要因為它要畫箭頭,因上我將一條線即視為一個Series,我試著用Data,但它需要有X/Y才能去記算箭頭的樣子,因此切記,需用SeriesData,一條線類似這樣,起/迄看你要不要箭頭
因為我只要迄有箭頭,只要在需要箭頭端定Symbol="arrow",這arrow即是在新增加的arrow.js中的定義
            List<SeriesData> line1 = new List<SeriesData>()
            {
                new SeriesData() { X = 8.29, Y = 0.35, Marker = new SeriesDataMarker() { Enabled = false, } },
                new SeriesData() { X = 9.22, Y = -0.05, Marker = new SeriesDataMarker() { Enabled = true, Symbol="arrow"} },
            };
重點還要在Series的Marker屬性Enable,這樣就能順利產生了
                    PlotOptionsLine = new PlotOptionsLine()
                    {
                        Marker = new PlotOptionsLineMarker() { Enabled = true },
                    },
完整程式
       public Highcharts NetCharts(string containerName)
        {
            Title title = new Title() { Text = "High Charts 網絡關係圖", };
            Subtitle subtitle = new Subtitle() { Text = "Jo呆含淚圖", };
            XAxis xaxis = new XAxis()
            {
                Title=new XAxisTitle()
                    {
                        Text="R+D",
                        Align = AxisTitleAligns.High,
                    },
                Labels= new XAxisLabels()
                    {
                        Enabled=false,
                    }
            };
            YAxis yaxis = new YAxis()
            {
                Title = new YAxisTitle()
                {
                    Text = "R-D",
                    Align = AxisTitleAligns.High,
                },
                Labels = new YAxisLabels()
                {
                    Enabled = false,
                }
            };

            List<Series> series = new List<Series>();

            List<SeriesData> line1 = new List<SeriesData>()
            {
                new SeriesData() { X = 8.29, Y = 0.35, Marker = new SeriesDataMarker() { Enabled = false, } },
                new SeriesData() { X = 9.22, Y = -0.05, Marker = new SeriesDataMarker() { Enabled = true, Symbol="arrow"} },
            };
            List<SeriesData> line2 = new List<SeriesData>()
            {
                new SeriesData() { X = 9.39, Y =0.63, Marker = new SeriesDataMarker() { Enabled = false, } },
                new SeriesData() { X = 8.29, Y = 0.35, Marker = new SeriesDataMarker() { Enabled = true, Symbol="arrow"} },
            };

            List<SeriesData> line3 = new List<SeriesData>()
            {
                new SeriesData() { X = 10.31, Y =-0.01, Marker = new SeriesDataMarker() { Enabled = false, } },
                new SeriesData() { X = 8.29, Y = 0.35, Marker = new SeriesDataMarker() { Enabled = true, Symbol="arrow"} },
            };
            List<SeriesData> line4 = new List<SeriesData>()
            {
                new SeriesData() { X = 9.39, Y =0.63, Marker = new SeriesDataMarker() { Enabled = false, } },
                new SeriesData() { X = 9.22, Y = -0.05, Marker = new SeriesDataMarker() { Enabled = true, Symbol="arrow"} },
            };
            List<SeriesData> line5 = new List<SeriesData>()
            {
                new SeriesData() { X = 9.39, Y =0.63, Marker = new SeriesDataMarker() { Enabled = false, } },
                new SeriesData() { X = 10.31, Y = -0.01, Marker = new SeriesDataMarker() { Enabled = true, Symbol="arrow"} },
            };
            List<SeriesData> line6 = new List<SeriesData>()
            {
                new SeriesData() { X = 10.31, Y =-0.01, Marker = new SeriesDataMarker() { Enabled = false, } },
                new SeriesData() { X = 9.22, Y = -0.05, Marker = new SeriesDataMarker() { Enabled = true, Symbol="arrow"} },
            };
            series.Add(
                new Series()
                {

                    Type= ChartTypes.Line,
                    Name="Line1",
                    Data = new Data(line1.ToArray()),
                    PlotOptionsLine = new PlotOptionsLine()
                    {
                        Marker = new PlotOptionsLineMarker() { Enabled = true },
                    },
                }
            );
            series.Add(
                new Series()
                {

                    Type = ChartTypes.Line,
                    Name = "Line2",
                    Data = new Data(line2.ToArray()),
                    PlotOptionsLine = new PlotOptionsLine()
                    {
                        Marker = new PlotOptionsLineMarker() { Enabled = true },
                    },
                }
            );
            series.Add(
                new Series()
                {

                    Type = ChartTypes.Line,
                    Name = "Line3",
                    Data = new Data(line3.ToArray()),
                    PlotOptionsLine = new PlotOptionsLine()
                    {
                        Marker = new PlotOptionsLineMarker() { Enabled = true },
                    },
                }
            );
            series.Add(
                new Series()
                {

                    Type = ChartTypes.Line,
                    Name = "Line4",
                    Data = new Data(line4.ToArray()),
                    PlotOptionsLine = new PlotOptionsLine()
                    {
                        Marker = new PlotOptionsLineMarker() { Enabled = true },
                    },
                }
            );

            series.Add(
                new Series()
                {

                    Type = ChartTypes.Line,
                    Name = "Line5",
                    Data = new Data(line5.ToArray()),
                    PlotOptionsLine = new PlotOptionsLine()
                    {
                        Marker = new PlotOptionsLineMarker() { Enabled = true },
                    },
                }
            );
            series.Add(
                new Series()
                {

                    Type = ChartTypes.Line,
                    Name = "Line6",
                    Data = new Data(line6.ToArray()),
                    PlotOptionsLine = new PlotOptionsLine()
                    {
                        Marker = new PlotOptionsLineMarker() { Enabled = true },
                    },
                }
            );

            var mycharts = new Highcharts(containerName);

            mycharts.InitChart(new Chart() {Type=ChartTypes.Line , Height = Number.GetNumber(600) })
                .SetTitle(title)
                .SetSubtitle(subtitle)
                .SetSeries(series.ToArray())
                .SetYAxis(yaxis)
                .SetXAxis(xaxis)
                ;
            return mycharts;
        }
打雜打久了,就變成打雜妹
程式寫久了,就變成老乞丐