在Asp.net上使用Chart圖
心血來潮來研究.Net Chart Control,印象初出社會時為了將數據圖表化時,
花了不少時間找了Third Party元件,使用Delphi開發,然後在掛載到網頁上,
那個時候可花了不少時間呢,沒想到現在畫Chart圖居然會如此容易,我先
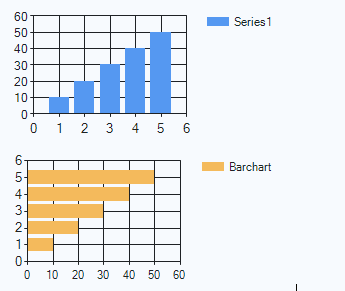
參考的MSDN教學的方式直接設定屬性初步完成了。
但是這樣的Hard code的作法,並不是我想要的,所以我模擬了如上的操作
在Server Side寫下如下
         Dim chart1 As New Chart()
        '新增CharAreas(Chart上可以放好幾個圖)
        chart1.ChartAreas.Add("NewChartArea")
        '建立圖表內資料
        chart1.Series.Add("Series1")
        chart1.Series("Series1").ChartArea = "NewChartArea"
        '設定為直條圖
        chart1.Series("Series1").ChartType = SeriesChartType.Column
        '加入資料
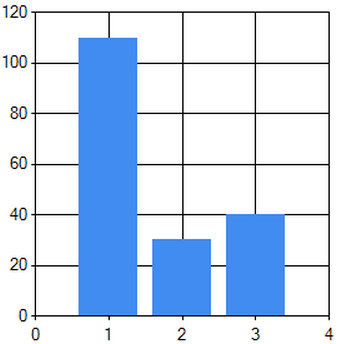
        chart1.Series("Series1").Points.Add(110)
        chart1.Series("Series1").Points.Add(30)
        chart1.Series("Series1").Points.Add(40)

        Page.Controls.Add(chart1)
Display as below
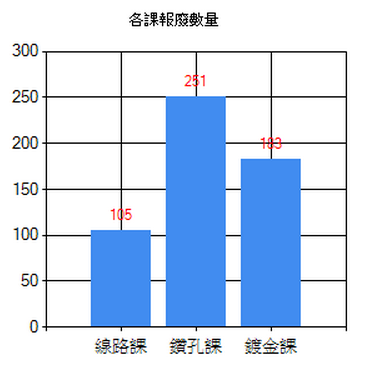
但是我還是不滿足阿! 我希望能在每一個直條圖上能顯示是哪個單位的數據統計
修改後變得如下
        Dim xValues As String() = {"線路課", "鑽孔課", "鍍金"}
        Dim yValues As Integer() = {105, 251, 183}

        Dim chart1 As New Chart()
        '訂定標題
        chart1.Titles.Add("各課報廢數量")
        '新增CharAreas(Chart上可以放好幾個圖)
        chart1.ChartAreas.Add("NewChartArea")
        '建立圖表內資料
        chart1.Series.Add("Series1")
        chart1.Series("Series1").ChartArea = "NewChartArea"
        chart1.Series("Series1").ChartType = SeriesChartType.Column
        chart1.Series("Series1").Points.DataBindXY(xValues, yValues)
        '將數值顯示於長條圖上
        chart1.Series("Series1").LabelForeColor = Color.Red
        chart1.Series("Series1").IsValueShownAsLabel = True
        Page.Controls.Add(chart1)
show as below
最後爬文,有人佛心來了,整理得好清楚,以下都是我參考別人文章翻轉成VB完成了,
有興趣的人可以看看原文出處的地方。
Dim xValues As String() = {"數值1", "數值2"}

Dim titleArr As String() = {"活動1", "活動2"}

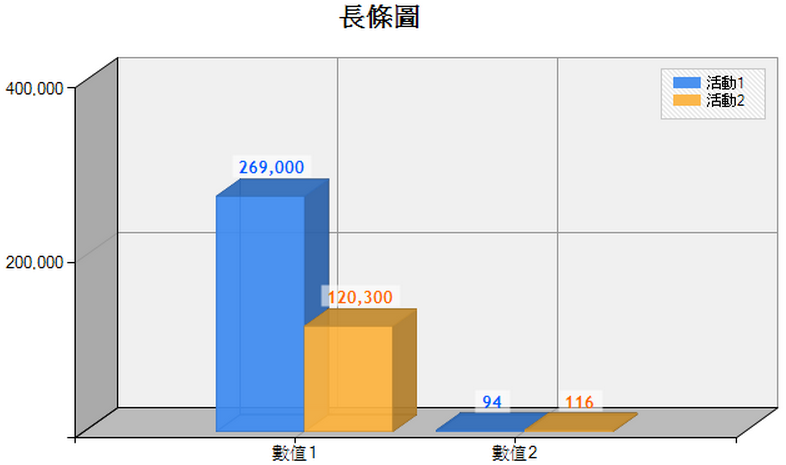
Dim yValues As Integer() = {269000, 94}

Dim yValues2 As Integer() = {120300, 116}


'ChartAreas,Series,Legends 基本設定--------------------------------------------------

Dim Chart1 As New Chart()

Chart1.ChartAreas.Add("ChartArea1")
'圖表區域集合
Chart1.Series.Add("Series1")
'數據序列集合
Chart1.Series.Add("Series2")

Chart1.Legends.Add("Legends1")
'圖例集合


'設定 Chart

Chart1.Width = 700

Chart1.Height = 400

Dim title As New Title()

title.Text = "長條圖"

title.Alignment = ContentAlignment.MiddleCenter

title.Font = New System.Drawing.Font("Trebuchet MS", 14F, FontStyle.Bold)

Chart1.Titles.Add(title)


'設定 ChartArea----------------------------------------------------------------------

Chart1.ChartAreas("ChartArea1").Area3DStyle.Enable3D = True
'3D效果
Chart1.ChartAreas("ChartArea1").Area3DStyle.IsClustered = True
'並排顯示
Chart1.ChartAreas("ChartArea1").Area3DStyle.Rotation = 40
'垂直角度
Chart1.ChartAreas("ChartArea1").Area3DStyle.Inclination = 50
'水平角度
Chart1.ChartAreas("ChartArea1").Area3DStyle.PointDepth = 30
'數據條深度
Chart1.ChartAreas("ChartArea1").Area3DStyle.WallWidth = 0
'外牆寬度
Chart1.ChartAreas("ChartArea1").Area3DStyle.LightStyle = LightStyle.Realistic
'光源
Chart1.ChartAreas("ChartArea1").BackColor = Color.FromArgb(240, 240, 240)
'背景色
Chart1.ChartAreas("ChartArea1").AxisX2.Enabled = AxisEnabled.[False]
'隱藏 X2 標示
Chart1.ChartAreas("ChartArea1").AxisY2.Enabled = AxisEnabled.[False]
'隱藏 Y2 標示
Chart1.ChartAreas("ChartArea1").AxisY2.MajorGrid.Enabled = False
'隱藏 Y2 軸線
'Y 軸線顏色

Chart1.ChartAreas("ChartArea1").AxisY.MajorGrid.LineColor = Color.FromArgb(150, 150, 150)

'X 軸線顏色

Chart1.ChartAreas("ChartArea1").AxisX.MajorGrid.LineColor = Color.FromArgb(150, 150, 150)

Chart1.ChartAreas("ChartArea1").AxisY.LabelStyle.Format = "#,###"

'Chart1.ChartAreas["ChartArea1"].AxisY2.Maximum = 160;

'Chart1.ChartAreas["ChartArea1"].AxisY2.Interval = 20;


'設定 Legends------------------------------------------------------------------------

Chart1.Legends("Legends1").DockedToChartArea = "ChartArea1"
'顯示在圖表內
'Chart1.Legends["Legends1"].Docking = Docking.Bottom; //自訂顯示位置

Chart1.Legends("Legends1").BackColor = Color.FromArgb(235, 235, 235)
'背景色
'斜線背景

Chart1.Legends("Legends1").BackHatchStyle = ChartHatchStyle.DarkDownwardDiagonal

Chart1.Legends("Legends1").BorderWidth = 1

Chart1.Legends("Legends1").BorderColor = Color.FromArgb(200, 200, 200)


'設定 Series-----------------------------------------------------------------------

Chart1.Series("Series1").ChartType = SeriesChartType.Column
'直條圖
'Chart1.Series["Series1"].ChartType = SeriesChartType.Bar; //橫條圖

Chart1.Series("Series1").Points.DataBindXY(xValues, yValues)

Chart1.Series("Series1").Legend = "Legends1"

Chart1.Series("Series1").LegendText = titleArr(0)

Chart1.Series("Series1").LabelFormat = "#,###"
'金錢格式
Chart1.Series("Series1").MarkerSize = 8
'Label 範圍大小
Chart1.Series("Series1").LabelForeColor = Color.FromArgb(0, 90, 255)
'字體顏色
'字體設定

Chart1.Series("Series1").Font = New System.Drawing.Font("Trebuchet MS", 10, System.Drawing.FontStyle.Bold)

'Label 背景色

Chart1.Series("Series1").LabelBackColor = Color.FromArgb(150, 255, 255, 255)

Chart1.Series("Series1").Color = Color.FromArgb(240, 65, 140, 240)
'背景色
Chart1.Series("Series1").IsValueShownAsLabel = True
' Show data points labels


Chart1.Series("Series2").Points.DataBindXY(xValues, yValues2)

Chart1.Series("Series2").Legend = "Legends1"

Chart1.Series("Series2").LegendText = titleArr(1)

Chart1.Series("Series2").LabelFormat = "#,###"
'金錢格式
Chart1.Series("Series2").MarkerSize = 8
'Label 範圍大小
Chart1.Series("Series2").LabelForeColor = Color.FromArgb(255, 103, 0)

Chart1.Series("Series2").Font = New System.Drawing.Font("Trebuchet MS", 10, FontStyle.Bold)

Chart1.Series("Series2").LabelBackColor = Color.FromArgb(150, 255, 255, 255)

Chart1.Series("Series2").Color = Color.FromArgb(240, 252, 180, 65)
'背景色
Chart1.Series("Series2").IsValueShownAsLabel = True
'顯示數據
Page.Controls.Add(Chart1)


Dim output As String = "..."
'output data table
Dim label As New Label()

label.Text = output

Page.Controls.Add(label)
Display as Below


