[WM][VB][老闆愛看的圖]
如果你的老闆想要在手機裡面看到美美的圖表怎辦辦,沒問題我可以利用「Google 圖表 API」可讓您動態產生圖表,參考http://code.google.com/intl/zh-TW/apis/chart/#shape_markers
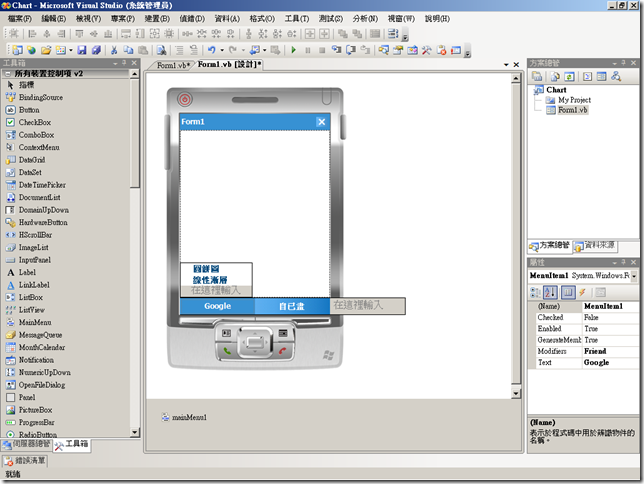
Step1:開啟vs2008 新增一個vb 智慧型裝置專案,在表單上產一個PictureBox顯示圖片,二個功能表按Google、自己畫及子鍵(圓餅圖、線性漸層)
Step2:撰寫程式碼
 Imports System.Net
  Imports System.IO
  Public Class Form1
  Private Sub GetImage(ByVal URL As String)
  Dim HttpWReq As HttpWebRequest = CType(WebRequest.Create(URL), HttpWebRequest)
  Dim HttpWResp As HttpWebResponse = CType(HttpWReq.GetResponse(), HttpWebResponse)
  Dim dataStream As Stream = HttpWResp.GetResponseStream()
  PictureBox1.Image = New Bitmap(dataStream)
  HttpWResp.Close()
  End Sub
  Private Sub MenuItem3_Click(ByVal sender As System.Object, ByVal e As System.EventArgs) Handles MenuItem3.Click
  '圓餅圖
'圓餅圖  GetImage("http://chart.apis.google.com/chart?chs=200x100&chd=t:60,20,20&cht=p3&chl=kylin|jack|Neil")
  End Sub
 Private Sub MenuItem4_Click(ByVal sender As System.Object, ByVal e As System.EventArgs) Handles MenuItem4.Click
  '線性漸層
'線性漸層  GetImage("http://chart.apis.google.com/chart?cht=lc&chd=s:pqokeYONOMEBAKPOQVTXZdecaZcglprqxuux393ztpoonkeggjp&chco=676767&chls=4.0,3.0,0.0&chs=240x240&chxt=x,y&chxl=0:|1|2|3|4|5|1:|0|50|100&chf=c,lg,90,76A4FB,0.5,ffffff,0|bg,s,EFEFEF")
  End Sub
 Private Sub MenuItem5_Click(ByVal sender As System.Object, ByVal e As System.EventArgs) Handles MenuItem5.Click
  '線條圖
'線條圖  PictureBox1.Visible = False
  Dim g As Graphics = Me.CreateGraphics
  Dim vertFont As New Font("Verdana", 10, FontStyle.Bold)
  Dim horzFont As New Font("Verdana", 10, FontStyle.Bold)
  Dim vertBrush As New SolidBrush(Color.Black)
  Dim horzBrush As New SolidBrush(Color.Blue)
  Dim blackPen As New Pen(Color.Black, 2)
  Dim bluePen As New Pen(Color.Blue, 2)
  g.DrawLine(blackPen, 50, 220, 50, 25)
  g.DrawLine(bluePen, 50, 220, 250, 220)
  g.DrawString("0", horzFont, horzBrush, 30, 220)
  g.DrawString("1", horzFont, horzBrush, 50, 220)
  g.DrawString("2", horzFont, horzBrush, 70, 220)
  g.DrawString("3", horzFont, horzBrush, 90, 220)
  g.DrawString("4", horzFont, horzBrush, 110, 220)
  g.DrawString("5", horzFont, horzBrush, 130, 220)
  g.DrawString("6", horzFont, horzBrush, 150, 220)
  g.DrawString("7", horzFont, horzBrush, 170, 220)
  g.DrawString("8", horzFont, horzBrush, 190, 220)
  g.DrawString("9", horzFont, horzBrush, 210, 220)
  g.DrawString("10", horzFont, horzBrush, 230, 220)
  Dim vertStrFormat As New StringFormat
  vertStrFormat.FormatFlags = StringFormatFlags.NoWrap
  g.DrawString("-", horzFont, horzBrush, 50, 212, vertStrFormat)
  g.DrawString("-", horzFont, horzBrush, 70, 212, vertStrFormat)
  g.DrawString("-", horzFont, horzBrush, 90, 212, vertStrFormat)
  g.DrawString("-", horzFont, horzBrush, 110, 212, vertStrFormat)
  g.DrawString("-", horzFont, horzBrush, 130, 212, vertStrFormat)
  g.DrawString("-", horzFont, horzBrush, 150, 212, vertStrFormat)
  g.DrawString("-", horzFont, horzBrush, 170, 212, vertStrFormat)
  g.DrawString("-", horzFont, horzBrush, 190, 212, vertStrFormat)
  g.DrawString("-", horzFont, horzBrush, 210, 212, vertStrFormat)
  g.DrawString("-", horzFont, horzBrush, 230, 212, vertStrFormat)
  g.DrawString("100-", vertFont, vertBrush, 20, 20)
  g.DrawString("90 -", vertFont, vertBrush, 25, 40)
  g.DrawString("80 -", vertFont, vertBrush, 25, 60)
  g.DrawString("70 -", vertFont, vertBrush, 25, 80)
  g.DrawString("60 -", vertFont, vertBrush, 25, 100)
  g.DrawString("50 -", vertFont, vertBrush, 25, 120)
  g.DrawString("40 -", vertFont, vertBrush, 25, 140)
  g.DrawString("30 -", vertFont, vertBrush, 25, 160)
  g.DrawString("20 -", vertFont, vertBrush, 25, 180)
  g.DrawString("10 -", vertFont, vertBrush, 25, 200)
  vertFont.Dispose()
  horzFont.Dispose()
  vertBrush.Dispose()
  horzBrush.Dispose()
  blackPen.Dispose()
  bluePen.Dispose()
  Dim linePen As New Pen(Color.Green, 1)
  Dim ellipsePen As New Pen(Color.Red, 1)
  g.DrawLine(linePen, 50, 217, 70, 150)
  g.DrawRectangle(ellipsePen, 70 - 2, 150 - 2, 4, 4)
  g.DrawLine(linePen, 70, 150, 90, 200)
  g.DrawRectangle(ellipsePen, 90 - 2, 200 - 2, 4, 4)
  linePen.Dispose()
  ellipsePen.Dispose()
  End Sub
 Private Sub MenuItem6_Click(ByVal sender As System.Object, ByVal e As System.EventArgs) Handles MenuItem6.Click
  '長條圖
'長條圖  PictureBox1.Visible = False
  Dim Blue As Brush = New SolidBrush(Color.Blue)
  Dim Red As Brush = New SolidBrush(Color.Red)
  Dim Purple As Brush = New SolidBrush(Color.Purple)
  Dim Green As Brush = New SolidBrush(Color.Green)
  Dim Yellow As Brush = New SolidBrush(Color.Yellow)
  Dim Black As Pen = New Pen(Color.Black, 3)
  Dim total As Decimal
  Dim data(5) As Decimal
  Dim percentage(5) As Decimal
  data(0) = Val("10")
  data(1) = Val("20")
  data(2) = Val("30")
  data(3) = Val("40")
  data(4) = Val("50")
  If data(0) = 0 And data(1) = 0 And data(2) = 0 Then Exit Sub
  total = data(0) + data(1) + data(2) + data(3) + data(4)
  percentage(0) = data(0) / total
  percentage(1) = data(1) / total
  percentage(2) = data(2) / total
  percentage(3) = data(3) / total
  percentage(4) = data(4) / total
  Dim g As Graphics = Me.CreateGraphics
  g.Clear(Color.White)
  g.FillRectangle(Blue, 30, 30, 30, 300 * percentage(0))
  Dim drawFont As New Font("Arial", 9, FontStyle.Bold)
  Dim drawBrush As New SolidBrush(Color.Black)
  g.DrawString(data(0), drawFont, drawBrush, 30, 30)
  g.FillRectangle(Red, 65, 30, 30, 300 * percentage(1))
  g.DrawString(data(1), drawFont, drawBrush, 65, 30)
  g.FillRectangle(Purple, 100, 30, 30, 300 * percentage(2))
  g.DrawString(data(2), drawFont, drawBrush, 100, 30)
  g.FillRectangle(Green, 135, 30, 30, 300 * percentage(3))
  g.DrawString(data(3), drawFont, drawBrush, 135, 30)
  g.FillRectangle(Yellow, 170, 30, 30, 300 * percentage(4))
  g.DrawString(data(4), drawFont, drawBrush, 170, 30)
  g.Dispose()
  End Sub
  End Class
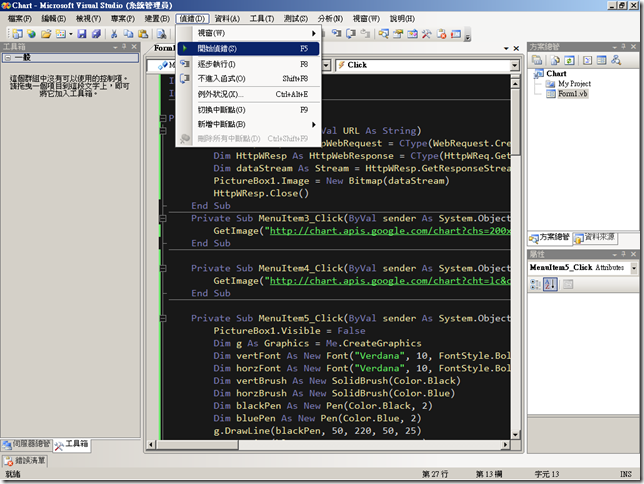
Step3:按下偵錯\開始偵錯來部署應用程式測試一下
Step4:按下Google\圓餅圖來看一下
Step5:按下Google\線性漸層來看一下
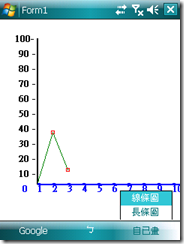
Step6:按下自己畫\線條圖來看一下
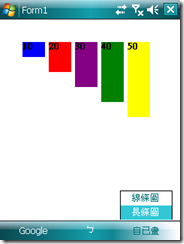
Step7:按下自己畫\長條圖來看一下
Step8: 源碼下載


 Imports
  Private


