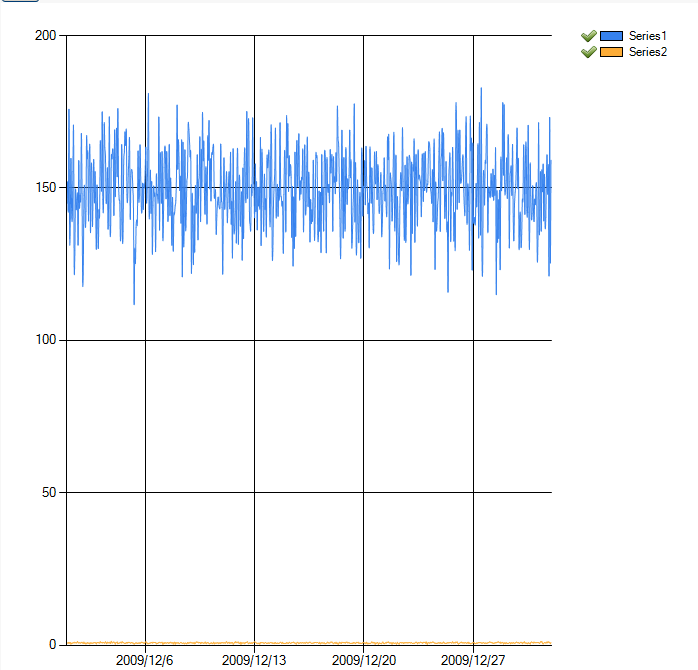
MS Chart Control是很好用又很漂亮的圖形工具,但有時候資料列太多互相重疊,想要看清楚資料又不想重新查詢,就要實作資料列隱藏/顯示功能.MS Chart Control並沒有內建此功能,所以我們就來自己動手做.
要做到這個功能要完成幾件事,首先要自訂圖例,這樣才不會在隱藏資料列時在圖例中消失,之後再加上Click Event的處理和用UpdatePanel更新就完成了.
MS Chart Control是很好用又很漂亮的圖形工具,但有時候資料列太多互相重疊,想要看清楚資料又不想重新查詢,就要實作資料列隱藏/顯示功能.MS Chart Control並沒有內建此功能,所以我們就來自己動手做.
要做到這個功能要完成幾件事,首先要自訂圖例,這樣才不會在隱藏資料列時在圖例中消失,之後再加上Click Event的處理和用UpdatePanel更新就完成了.
在VS裡,先從工具箱拉出一個ScriptManager,一個UpdatePanel,然後再拉一個Chart Control到UpdatePanel裡面.
<asp:UpdatePanel ID="UpdatePanel2" runat="server">
        <ContentTemplate>
            <asp:Chart ID="Chart1" runat="server" RenderType="ImageTag" ImageLocation="~/App_Themes/images/Chart_#UID"
                ImageStorageMode="UseImageLocation" EnableViewState="true" Width="700px"
                Height="700px" onclick="Chart1_Click">
                <Legends>
                    <asp:Legend Name="Legend1">
                    </asp:Legend>
                </Legends>
                <ChartAreas>
                    <asp:ChartArea Name="ChartArea1">
                    </asp:ChartArea>
                </ChartAreas>
            </asp:Chart>
        </ContentTemplate>
    </asp:UpdatePanel>
在這裡有設定一些參數,RenderType是你的Chart Control呈現模式,我這裡用的是輸出圖形標籤模式,其他方法請參考Chart Control的使用文件. ImageStorageMode是儲存圖檔的方法,我這裡是用給一個路徑的方法去存,ImageLocation就是存方圖檔的位置, 記得要定義圖形標籤的寬跟高,最後加入onclick處理方法.圖例可以用靜態定義也可以在Code-behind動態加入,是沒有差的.
然後我們就要在Code-Behind寫產生自定義圖例和onclick處理方法.我這裡假設Data Binding已經做好,想知道怎樣做Data Binding可以參考MS Chart Control官網.只有一件事要注意,就是我們在用自定義圖例,所以記把自動產生圖例功能關掉,方法是把Series的IsVisibleLegend給False.
接下來實作自定義圖例和產生其Click Event
Chart1.ApplyPaletteColors();
int l_index = 0;
foreach (Series series in this.Chart1.Series)
            {
                LegendItem l_customItem = new LegendItem() { Name = series.Name };
                l_customItem.Cells.Add(new LegendCell() { CellType = LegendCellType.Image, Image = "~/App_Themes/images/accept.png", Name = "image" });
                l_customItem.Cells.Add(new LegendCell() { CellType = LegendCellType.SeriesSymbol });

                l_customItem.Cells.Add(new LegendCell() { CellType = LegendCellType.Text, Text = series.Name });
                l_customItem.Color = series.Color;
                l_customItem.MarkerColor = series.Color;
                l_customItem.MarkerStyle = MarkerStyle.Square;
                l_customItem.PostBackValue = "LegendItem:" + series.Name + ",#" + l_index;
                Chart1.Legends["Legend1"].CustomItems.Add(l_customItem);

                l_index++;
            }
上面的迴圈會對每一個資料列加入一個圖例項目,這個項目會有兩個Cell是CheckBox圖檔,就是一個剔和一個叉的圖.
第二個Cell是資料列顏色,第三個Cell是資料列名稱.這裡有一件要特別注意的事,在Data Bind之後,如果不調用一次ApplyPaletteColors(),你會取得資料列顏色失敗.最後幫項目加上PostBackValue,讓處理onclick時知道是那一個項目被click.
我這裡自己去算index,Chart Control應該有提供Keyword功能,不用自己算,詳細方法可以看Alex Gorev的部落格.
完成產成自定義圖例後,大概長這樣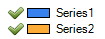
接下來就要處理onclick事件了
        /// <summary>
        /// Handles the Click event of the Chart1 control.
        /// </summary>
        /// <param name="sender">The source of the event.</param>
        /// <param name="e">The <see cref="System.Web.UI.WebControls.ImageMapEventArgs"/> instance containing the event data.</param>
        protected void Chart1_Click(object sender, ImageMapEventArgs e)
        {
            string[] input = e.PostBackValue.Split(':');
            if (input.Length == 2)
            {
                string[] seriesData = input[1].Split(',');
                Series l_selected = Chart1.Series[seriesData[0]];
                l_selected.Enabled = !l_selected.Enabled;
                int l_index = int.Parse(seriesData[1].TrimStart('#'));
                if (l_selected.Enabled)
                {
                    Chart1.Legends["Legend1"].CustomItems[l_index].Cells["image"].Image = "~/App_Themes/images/accept.png";
                }
                else
                {
                    Chart1.Legends["Legend1"].CustomItems[l_index].Cells["image"].Image = "~/App_Themes/images/cross.png";
                }
            }
        }
其實只是把PostBack回來的值做parsing,判斷是那一個被click,把他的剔圖換成叉圖,然後把資料列設成Enable = false.
更新元件的部份交給 UpdatePanel處理,就完成Ajax隱藏/顯示資料列的統計圖了.