NanoProfiler的NetCore版本就是CoreProfiler,使用方式和以前幾乎相同,
對code也不會有太大的侵入性
以前我使用nanoprofiler監控一個repuest進入一個API直到結束返回response,
由於一個action中可能會包含很多處理步驟,如Get Cache From Redis、Get Data From DB、Write Log to SQL Server、publish message to kafka…等,如果要詳細了解每一小部分執行效能,我想透過coreprofiler來處理應該是最有效率的,
當然你也可以自行透過Stopwatch計算執行效能,下面我簡單紀錄如何設定coreprofiler。
@install CoreProfiler and CoreProfiler.Web packages.
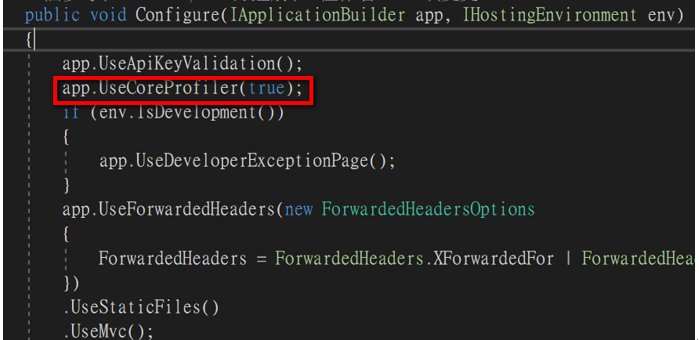
@enable CoreProfiler profiling in Startup.cs
@Add a coreprofiler.json file to your project
{
  "circularBufferSize": 200,
  "filters": [
    {
      "key": "/coreprofiler",
      "value": "/coreprofiler",
      "type": "CoreProfiler.ProfilingFilters.NameContainsProfilingFilter, CoreProfiler"
    },
    {
      "key": "/nanoprofiler",
      "value": "/nanoprofiler",
      "type": "CoreProfiler.ProfilingFilters.NameContainsProfilingFilter, CoreProfiler"
    },
    {
      "key": "static files",
      "value": "ico,jpg,js,css",
      "type": "CoreProfiler.ProfilingFilters.FileExtensionProfilingFilter, CoreProfiler"
    }
  ]
}
我們透過/coreprofiler/view 或 /nanoprofiler/view 查看CoreProfiler 結果,所以我們要過濾這兩個entrypoint的repuest
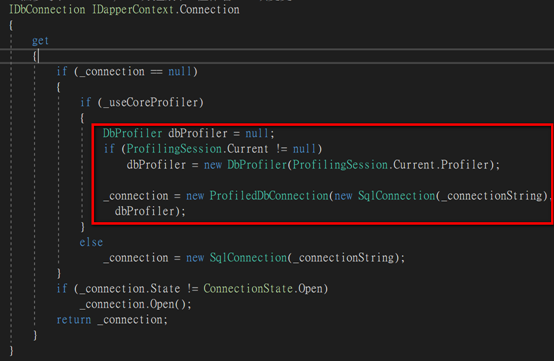
@wrap Dbconnection via ProfiledDbConnection
由於我要追蹤SQL Server,所以我會在IDapperContext進行處理,
另外我習慣透過flag來控制該功能是否啟用
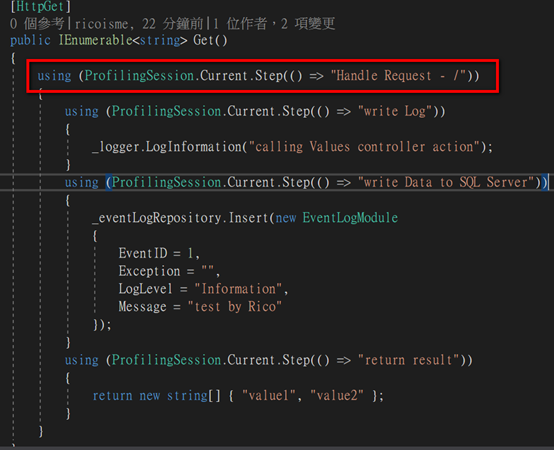
@add each step in controller
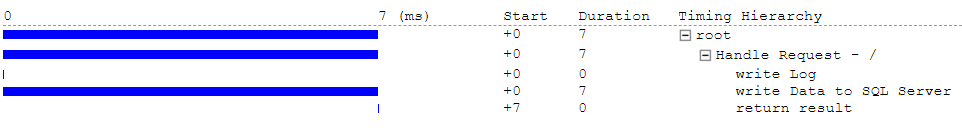
觀看結果
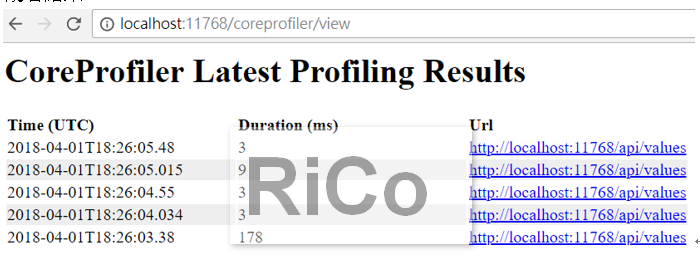
點Url可以繼續深入查看當時我們所設定的每個步驟執行效能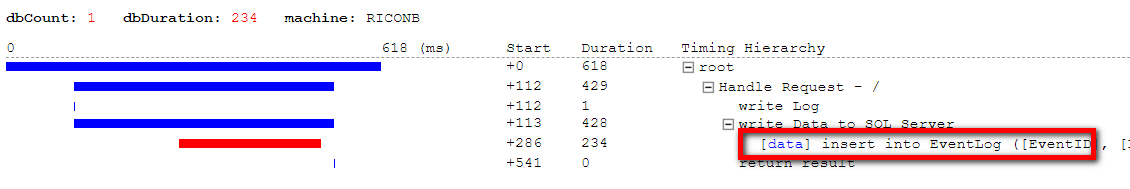
參考