搭配Dual Axis雙軸需要呈現Legend
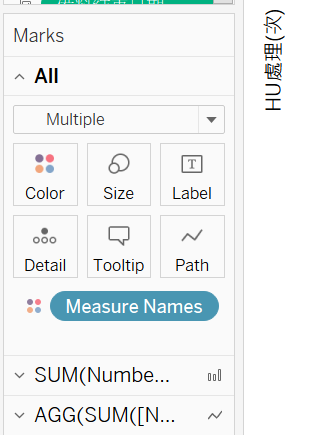
將Measure Name拉進去All 中,再show Legend
Using the "All" marks card (the top one), put Measure Names on the color shelf
https://stackoverflow.com/questions/32000891/tableau-show-legends-for-lines-charts-on-dual-axis
補充: 若需要在Show Legend中,強調圖形的Shape。Tableau目前無此功能能同時在一張Legend顯示Color和Shape,因此若需要則要添加客製的Sheet。
同時也歡迎追蹤Tableau Public Gallery- MR.360 |聚沙成塔,裡面包含文章中的案例實作,
期待能帶給您新的啟發或靈感。
未來文章將喬遷新址「一趟數據分析之旅」,歡迎追蹤繼續支持,您將不會錯過任何新知識。
