利用Chart實作圖表
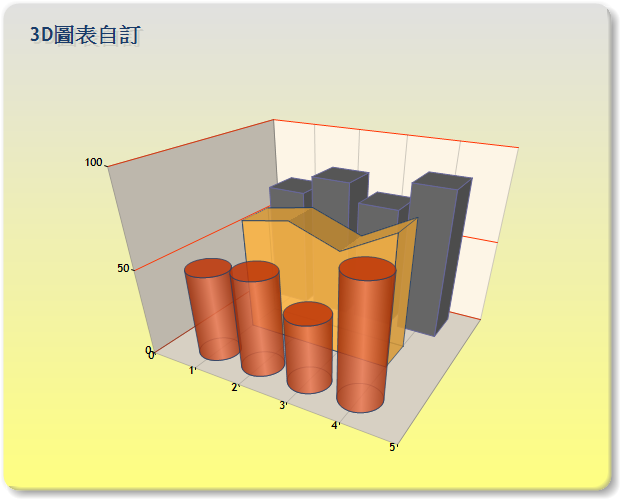
Chart控制項被譽為ASP.NET最強大且完善的圖表控制項,今天休假實作了一個3D自定式圖表,可以自由調整圖片,實作過程放上來給大家參考。
我只能說Chart太會搞人,下午本想抏完就出門去打球,沒想到搞到現在XD!
| 完整的VS2008設計支援 | 二進位與XML序列化 |
| 設計與執行之資料繫結 | 空資料點處理 |
| 35種圖表,支援3D型式 | 支援日期ˋ時間ˋ貨幣等型別 |
| 外觀可完整自訂 | 提供50種以上的財務與統計公式 |
| 圖表數目沒有限制 | 即時的圖表處理 |
| 數列數目沒有限制 | 提供繪製前與繪製後的事件功能 |
| 資料點數目沒有限制 | 支援AJAX |
| 支援資料的複製合併分割等功能 | 狀態管理 |
| 資料可匯出 | 二進位的資料流 |
首先,要自由的使用Chart,就必須下載Microsoft Chart Controls for Microsoft .NET Framework 3.5 套件 :http://www.microsoft.com/downloads/details.aspx?FamilyId=130F7986-BF49-4FE5-9CA8-910AE6EA442C&displaylang=en ←免費載點
安裝完以後發現發現vs2008沒有自動跑出來阿阿阿!!上網搜尋了一下發現demo大有做過說明了:http://demo.tc/Post/470,必須將其加入參考後才能使用。
參考完demo大的前車之鑑後,接下來辦事就快了,包含設定顏色等煩人的問題都得到了捷徑,以下附上實作後的程式碼。
009  <body>
010 <form id="form1" runat="server">
011 <div>
012 <table style="border: medium solid #000000">
013 <tr>
014 <td>
015 <asp:Chart ID="Chart1" runat="server" Height="499px" Width="620px" ImageType="Png"
016 BackColor="224, 224, 224" BorderDashStyle="Solid" Palette="Pastel" BackGradientStyle="TopBottom"
017 BorderWidth="2" BorderColor="181, 64, 1"
018 BackImageTransparentColor="255, 192, 128"
019 BackSecondaryColor="255, 255, 128">
020 <Titles>
021 <asp:Title ShadowColor="32, 0, 0, 0" Font="Trebuchet MS, 14.25pt, style=Bold" ShadowOffset="3"
022 Text="3D圖表自訂" Alignment="TopLeft" ForeColor="26, 59, 105">
023 </asp:Title>
024 </Titles>
025 <Legends>
026 <asp:Legend LegendStyle="Row" Enabled="False" Name="Default" BackColor="Transparent">
027 <Position Y="85" Height="5" Width="40" X="5"></Position>
028 </asp:Legend>
029 </Legends>
030 <BorderSkin SkinStyle="Emboss"></BorderSkin>
031 <Series>
032 <asp:Series ChartArea="ChartArea1" XValueType="Double" Name="Series1" ShadowColor="Transparent"
033 BorderColor="#666699" Color="#666666" Legend="Legend2"
034 YValueType="Double">
035 <Points>
036 <asp:DataPoint XValue="1" YValues="70" />
037 <asp:DataPoint XValue="2" YValues="80" />
038 <asp:DataPoint XValue="3" YValues="70" />
039 <asp:DataPoint XValue="4" YValues="85" />
040 </Points>
041 </asp:Series>
042 <asp:Series ChartArea="ChartArea1" XValueType="Double" Name="Series2" ChartType="Area"
043 CustomProperties="DrawingStyle=Cylinder" BorderColor="180, 26, 59, 105" Color="220, 252, 180, 65"
044 YValueType="Double">
045 <Points>
046 <asp:DataPoint XValue="1" YValues="65" />
047 <asp:DataPoint XValue="2" YValues="70" />
048 <asp:DataPoint XValue="3" YValues="60" />
049 <asp:DataPoint XValue="4" YValues="75" />
050 </Points>
051 </asp:Series>
052 <asp:Series ChartArea="ChartArea1" XValueType="Double" Name="Series3" CustomProperties="DrawingStyle=Cylinder"
053 BorderColor="180, 26, 59, 105" Color="220, 224, 64, 10"
054 YValueType="Double">
055 <Points>
056 <asp:DataPoint XValue="1" YValues="50" />
057 <asp:DataPoint XValue="2" YValues="55" />
058 <asp:DataPoint XValue="3" YValues="40" />
059 <asp:DataPoint XValue="4" YValues="70" />
060 </Points>
061 </asp:Series>
062 </Series>
063 <ChartAreas>
064 <asp:ChartArea Name="ChartArea1" BorderColor="64, 64, 64, 64" BackSecondaryColor="White"
065 BackColor="OldLace" ShadowColor="Transparent">
066 <Area3DStyle Rotation="40" Perspective="8" Enable3D="True" Inclination="18" IsRightAngleAxes="False"
067 WallWidth="0" IsClustered="False"></Area3DStyle>
068 <AxisY LineColor="64, 64, 64, 64" IsLabelAutoFit="False">
069 <LabelStyle Font="Trebuchet MS, 8.25pt, style=Bold" />
070 <MajorGrid LineColor="#FF3300" />
071 </AxisY>
072 <AxisX LineColor="64, 64, 64, 64" IsLabelAutoFit="False" Interval="1">
073 <LabelStyle Font="Trebuchet MS, 8.25pt, style=Bold" />
074 <MajorGrid LineColor="64, 64, 64, 64" />
075 </AxisX>
076 </asp:ChartArea>
077 </ChartAreas>
078 </asp:Chart>
079 </td>
080 <td valign="top">
081 <table cellpadding="4">
082 <tr>
083 <td>
084 資料點的深度:
085 <asp:DropDownList ID="PointDepth" runat="server" AutoPostBack="True">
086 <asp:ListItem Value="25">25</asp:ListItem>
087 <asp:ListItem Value="50">50</asp:ListItem>
088 <asp:ListItem Value="100" Selected="True">100</asp:ListItem>
089 <asp:ListItem Value="200">200</asp:ListItem>
090 <asp:ListItem Value="500">500</asp:ListItem>
091 <asp:ListItem Value="1000">1000</asp:ListItem>
092 </asp:DropDownList>
093 </td>
094 </tr>
095 <tr>
096 <td>
097 資料點間距深度:
098 <asp:DropDownList ID="PointGapDepth" runat="server" AutoPostBack="True">
099 <asp:ListItem Value="20">20</asp:ListItem>
100 <asp:ListItem Value="100" Selected="True">100</asp:ListItem>
101 <asp:ListItem Value="200">200</asp:ListItem>
102 <asp:ListItem Value="500">500</asp:ListItem>
103 <asp:ListItem Value="1000">1000</asp:ListItem>
104 </asp:DropDownList>
105 </td>
106 </tr>
107 <tr>
108 <td>
109 遠近景深:<asp:DropDownList ID="Perspective" runat="server" Width="60px" AutoPostBack="True">
110 <asp:ListItem Value="0">0</asp:ListItem>
111 <asp:ListItem Value="10">10</asp:ListItem>
112 <asp:ListItem Value="20">20</asp:ListItem>
113 <asp:ListItem Value="30" Selected="True">30</asp:ListItem>
114 <asp:ListItem Value="40">40</asp:ListItem>
115 <asp:ListItem Value="60">60</asp:ListItem>
116 <asp:ListItem Value="80">80</asp:ListItem>
117 <asp:ListItem Value="100">100</asp:ListItem>
118 </asp:DropDownList>
119 </td>
120 </tr>
121 <tr>
122 <td>
123 旋轉 X:
124 <asp:DropDownList ID="RotateX" runat="server" Width="60px" AutoPostBack="True">
125 <asp:ListItem Value="-90">-90</asp:ListItem>
126 <asp:ListItem Value="-70">-70</asp:ListItem>
127 <asp:ListItem Value="-50">-50</asp:ListItem>
128 <asp:ListItem Value="-30">-30</asp:ListItem>
129 <asp:ListItem Value="-10">-10</asp:ListItem>
130 <asp:ListItem Value="0">0</asp:ListItem>
131 <asp:ListItem Value="10">10</asp:ListItem>
132 <asp:ListItem Value="15">15</asp:ListItem>
133 <asp:ListItem Value="30" Selected="True">30</asp:ListItem>
134 <asp:ListItem Value="50">50</asp:ListItem>
135 <asp:ListItem Value="70">70</asp:ListItem>
136 <asp:ListItem Value="90">90</asp:ListItem>
137 </asp:DropDownList>
138 </td>
139 </tr>
140 <tr>
141 <td>
142 旋轉 Y:
143 <asp:DropDownList ID="RotateY" runat="server" AutoPostBack="True">
144 <asp:ListItem Value="-80">-80</asp:ListItem>
145 <asp:ListItem Value="-60">-60</asp:ListItem>
146 <asp:ListItem Value="-40">-40</asp:ListItem>
147 <asp:ListItem Value="-20">-20</asp:ListItem>
148 <asp:ListItem Value="0">0</asp:ListItem>
149 <asp:ListItem Value="20">20</asp:ListItem>
150 <asp:ListItem Value="30">30</asp:ListItem>
151 <asp:ListItem Value="40" Selected="True">40</asp:ListItem>
152 <asp:ListItem Value="60">60</asp:ListItem>
153 <asp:ListItem Value="80">80</asp:ListItem>
154 </asp:DropDownList>
155 </td>
156 </tr>
157 </table>
158 </td>
159 </tr>
160 </table>
161 </div>
162 </form>
163 </body>
164 </html>
後製程式碼
 protected void Page_Load(object sender, EventArgs e)
 02
 {
{ 
03
// 設定資料點的深度。 04
Chart1.ChartAreas["ChartArea1"].Area3DStyle.PointDepth = int.Parse(PointDepth.SelectedItem.Text); 05
06
// 設定資料點的間距深度。 07
Chart1.ChartAreas["ChartArea1"].Area3DStyle.PointGapDepth = int.Parse(PointGapDepth.SelectedItem.Text); 08
09
// 設定遠近景深。 10
Chart1.ChartAreas["ChartArea1"].Area3DStyle.Perspective = int.Parse(Perspective.SelectedItem.Value); 11
12
// 設定 X 角度。 13
Chart1.ChartAreas["ChartArea1"].Area3DStyle.Inclination = int.Parse(RotateX.SelectedItem.Value); 14
15
// 設定 Y 角度。 16
Chart1.ChartAreas["ChartArea1"].Area3DStyle.Rotation = int.Parse(RotateY.SelectedItem.Text); 17
18
 }
}執行截圖:
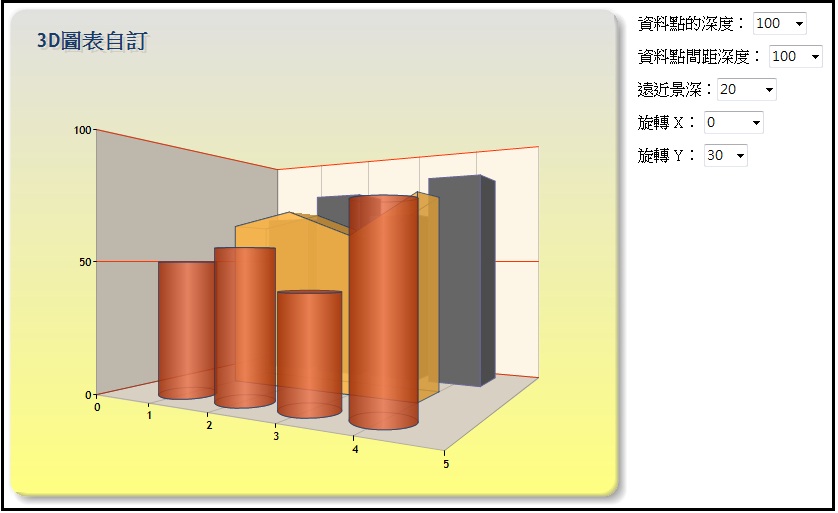
.net framework4.0好像有內建此控制項了,但3.5sp1還是要安裝套件喔!!
另外Chart還有資料繫結的功能,之後有實作在放上來討論,無論如何,Chart功能讓程式設計人員在提供客戶使用圖表報表時有更大的發揮空間與方便性,設計過程也很直覺化。

|