文字雲(Word Cloud)是統計關鍵字詞的視覺化呈現,如果分析資料已經整理到SQL Server資料表中了,我們要如何在ASP.NET網站將統計後的結果使用文字雲來描述?
文字雲(Word Cloud)同義字有標籤雲、雲標籤、詞雲。
是文字探勘或字詞分析後的一種呈現,以往在文字探勘時,會從網站爬(crawl)資料下來成文字檔案,接著作文字探勘(text mining)、作資料整理(清理),
最後一步就是將資料視覺化(visualization),文字雲是常見的選擇,父親節的晚上來筆記。
實作資料庫統計資料呈現Word Cloud想到兩個做法
- A:In-DataBase R內透過sp_execute_external_script將資料輸入到@input_data_1執行,執行完成後回傳圖片。
- B:從R的環境使用套件Rodbc或是sqldf從資料庫將資料表取回成dataframe執行,執行完成後回傳圖片。
- C:如果不在資料庫端,AP端也有一些可以參考: Word Cloud (Tag Cloud) Generator Control for .NET Windows.Forms in C#
先用A計畫,參考前一篇將資料呈現在前端網站的做法,步驟如下:
- 安裝使用到的R Package。
- 準備輸入的資料@input_data_1
- DB端:建立預存程序執行R Script,執行結束後將文字雲結果以varbinary格式回傳。
- AP端:執行完成後回傳圖片,設定一個簡單的model接。
- AP端:新增一個MVC控制器來處理Model和檢視,這邊我們直接用Dapper call stored procedure(預存程序)。
- AP端:在controller方法前新增MVC檢視Index.cshtml
1.安裝使用到的R Package到SQL Server中。
可以參考先前R Package的安裝方式,將以下3個套件
- RColorBrewer
- slam
- wordcloud
安裝到SQL Server指定的instance中。
2.準備輸入的資料框@input_data_1
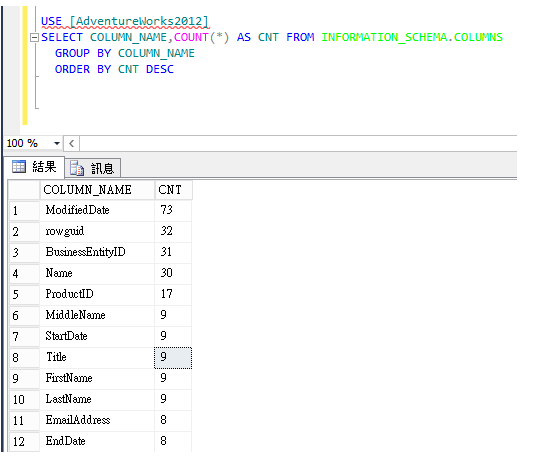
假設我們想分析AdventureWorks2012中各欄位(column)使用次數的統計,這邊使用到Information Schema Views,直接統計欄位名稱使用次數。
USE[AdventureWorks2012]
SELECT COLUMN_NAME, COUNT(*) AS CNT FROM INFORMATION_SCHEMA.COLUMNS
   GROUP BY COLUMN_NAME
檢視資料內容,modifiedDate、rowguid、BusinessEntityID及Name在AdventureWorks2012資料庫中都超過30次使用。
3.DB端:建立預存程序執行R Script(usp_wordcloud),執行結束後將文字雲結果以varbinary格式回傳。
create proc usp_wordcloud as
execute sp_execute_external_script
  @language = N'R'
, @script = N'
image_file = tempfile();
jpeg(filename = image_file,width=800,height=600);
library(RColorBrewer)
library(wordcloud)
print(wordcloud(InputDataSet$COLUMN_NAME, InputDataSet$CNT, min.freq = 2, scale = c(8, 0.8), colors = brewer.pal(n = 8, name = ''Dark2'')));
dev.off();
OutputDataSet <- data.frame(data=readBin(file(image_file,"rb"),what=raw(),n=1e6));
'
, @input_data_1 = N'
SELECT COLUMN_NAME,COUNT(*) AS CNT FROM AdventureWorks2012.INFORMATION_SCHEMA.COLUMNS
  GROUP BY COLUMN_NAME'
WITH RESULT SETS ((plot varbinary(max) NOT NULL));
R語法可以參考線上Help文件
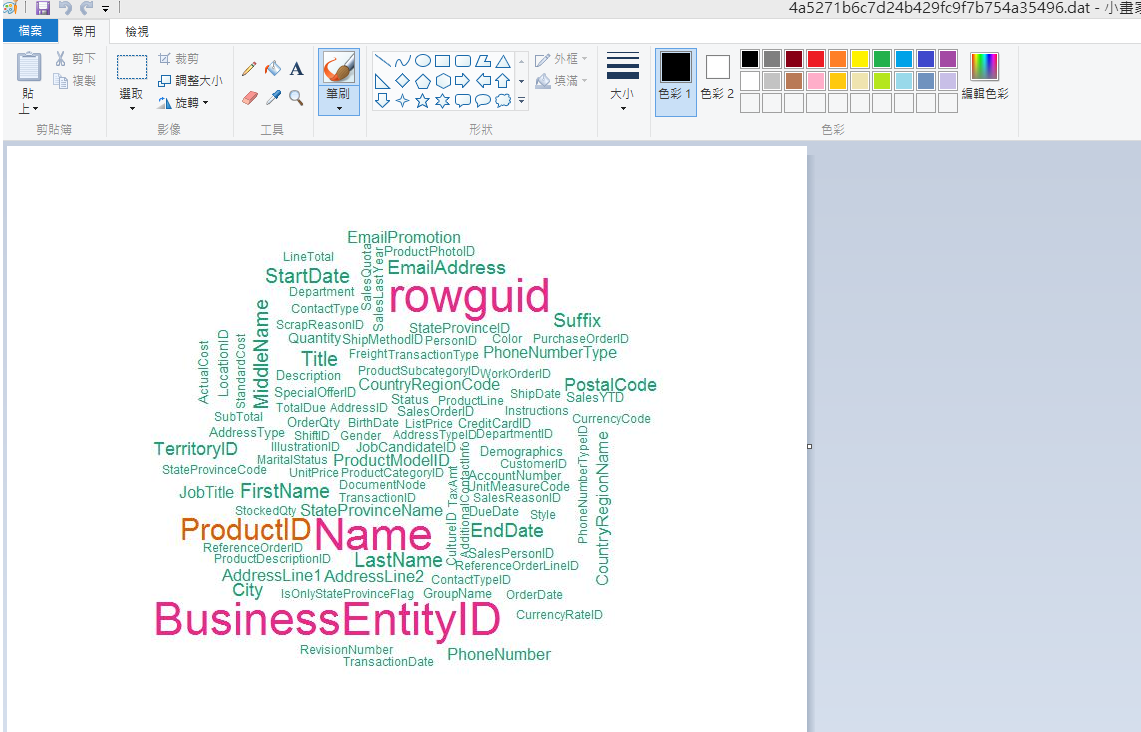
測試結果:
按右鍵利用SSMSBoost顯示圖片結果。
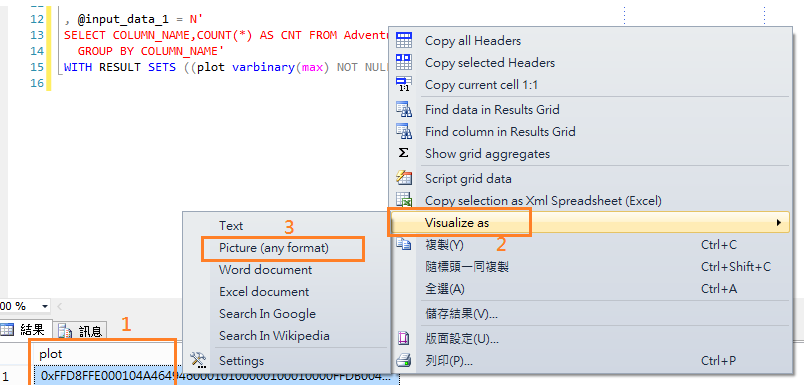
文字雲
到這邊大致完成DB端的設定,接著處理前端的網站。
4. AP端:DB執行R Script會回傳圖片,設定一個簡單的model接。
Model資料夾新增一個Plot.cs
using System;
using System.Collections.Generic;
using System.Linq;
using System.Web;

namespace WebApi.Models
{
    public class Plot
    {
        public byte[] plot { get; set; }
    }
}
5. AP端:新增一個MVC控制器PlotController.cs來處理前面的Model、後面檢視並且呼叫R Script。
using System.Data;
using System.Data.SqlClient;
using System.Linq;
using System.Web.Mvc;
using WebApi.Models;

namespace WebApi.Controllers
{
    public class PlotController : Controller
    {
        public string CN = @"Data Source=Stanley14\SQL2016;Initial Catalog=tempdb;User ID=CyberCArd;Password=Passw0rd";
        // GET: Image
        public ActionResult Index()
        {
            using (SqlConnection db = new SqlConnection(CN))
            {
                var table = db.Query<Plot>("usp_wordcloud", commandType: CommandType.StoredProcedure);
                return View(table.First());
            }
        }
    }
}
6. AP端:在controller方法前新增檢視Index.cshtml
![]()
@model WebApi.Models.Plot
@{
    Layout = null;
}
<!DOCTYPE html>
<html>
<head>
    <meta name="viewport" content="width=device-width" />
    <title>Index</title>
</head>
<body>
    <div>
    </div>
    @{
        var base64 = Convert.ToBase64String(Model.plot);
        var imgPlot = String.Format("data:image/gif;base64,{0}", base64);
    }
    <img src="@imgPlot" />
</body>
</html>
7.執行網站
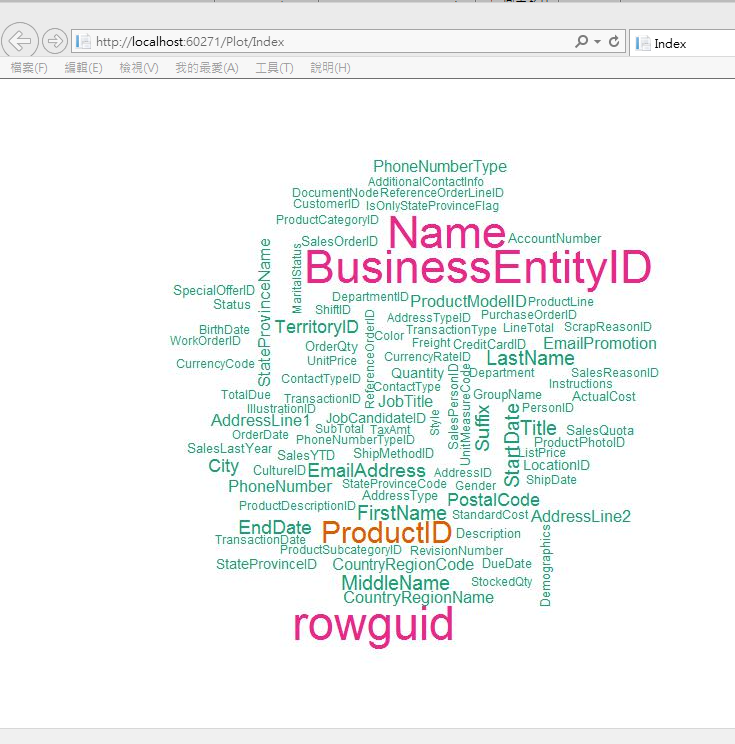
是不是聯想到其他的應用了? 百家姓? 刷卡消費地點 ? 消費類別 ?
筆記了SQL Server、ASP.NET網站整合R的繪圖及統計功能,接下來幾個週末,希望繼續筆記幾種簡單的機器學習(Machine learning),
試著監督式(分類、迴歸)到非監督式學習(分群、類神經網路),試著在SQL Server 2016 中訓練模型、儲存模型到使用模型。
今天是父親節,最近抱女兒太久,雙手=爸爸手+滑鼠手。
參考:
How I used R to create a word cloud, step by step