這是一個用SVG刻出來的統計圖表,其實應該寫成工具的方式吃個JSON來產生會更好....
效果:
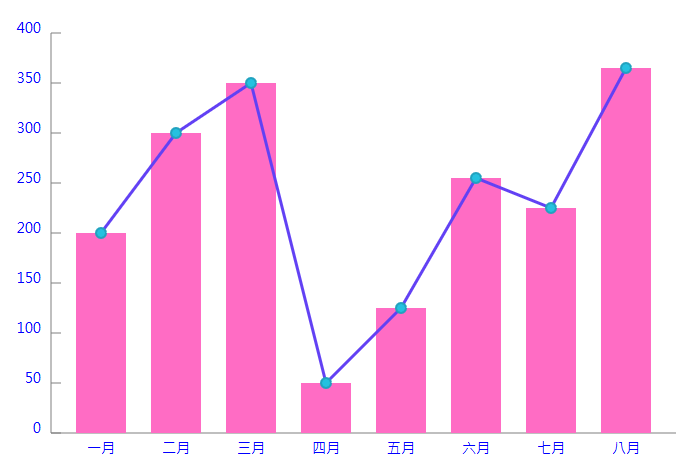
HTML:
<svg id="svgBarChart" width="800" height="800">

  <!-- X軸 -->
  <line stroke="gray" x1="100" y1="500" x2="725" y2="500"/>

  <!-- X軸標籤 -->
  <text x="150" y="520" font-size="14" text-anchor="middle" fill="blue">一月</text>
  <text x="225" y="520" font-size="14" text-anchor="middle" fill="blue">二月</text>
  <text x="300" y="520" font-size="14" text-anchor="middle" fill="blue">三月</text>
  <text x="375" y="520" font-size="14" text-anchor="middle" fill="blue">四月</text>
  <text x="450" y="520" font-size="14" text-anchor="middle" fill="blue">五月</text>
  <text x="525" y="520" font-size="14" text-anchor="middle" fill="blue">六月</text>
  <text x="600" y="520" font-size="14" text-anchor="middle" fill="blue">七月</text>
  <text x="675" y="520" font-size="14" text-anchor="middle" fill="blue">八月</text>

  <!-- Y軸 -->
  <line stroke="gray" x1="100" y1="100" x2="100" y2="500"/>

  <!-- Y軸標籤 -->
  <text x="90" y="500" font-size="14" text-anchor="end" fill="blue">0</text>
  <text x="90" y="450" font-size="14" text-anchor="end" fill="blue">50</text>
  <text x="90" y="400" font-size="14" text-anchor="end" fill="blue">100</text>
  <text x="90" y="350" font-size="14" text-anchor="end" fill="blue">150</text>
  <text x="90" y="300" font-size="14" text-anchor="end" fill="blue">200</text>
  <text x="90" y="250" font-size="14" text-anchor="end" fill="blue">250</text>
  <text x="90" y="200" font-size="14" text-anchor="end" fill="blue">300</text>
  <text x="90" y="150" font-size="14" text-anchor="end" fill="blue">350</text>
  <text x="90" y="100" font-size="14" text-anchor="end" fill="blue">400</text>

  <!--Bar -->
  <rect id="A" x="125" y="300" fill="#FF6CC4" width="50" height="200"/>
  <rect id="A" x="200" y="200" fill="#FF6CC4" width="50" height="300"/>
  <rect id="A" x="275" y="150" fill="#FF6CC4" width="50" height="350"/>
  <rect id="A" x="350" y="450" fill="#FF6CC4" width="50" height="50"/>
  <rect id="A" x="425" y="375" fill="#FF6CC4" width="50" height="125"/>
  <rect id="A" x="500" y="245" fill="#FF6CC4" width="50" height="255"/>
  <rect id="A" x="575" y="275" fill="#FF6CC4" width="50" height="225"/>
  <rect id="A" x="650" y="135" fill="#FF6CC4" width="50" height="365"/>

  <!-- 折線 -->
  <path d="M150 300 L225 200 L300 150 L375 450 L 450 375 L525 245 L600 275 L675 135" stroke="#6241f4" stroke-width="3" fill="none"/>

  <!-- 在折線的點上加上圓圈 -->
  <circle fill="#24C1E0" stroke="#21A2BF" stroke-width="2" cx="150" cy="300" r="5"/>
  <circle fill="#24C1E0" stroke="#21A2BF" stroke-width="2" cx="225" cy="200" r="5"/>
  <circle fill="#24C1E0" stroke="#21A2BF" stroke-width="2" cx="300" cy="150" r="5"/>
  <circle fill="#24C1E0" stroke="#21A2BF" stroke-width="2" cx="375" cy="450" r="5"/>
  <circle fill="#24C1E0" stroke="#21A2BF" stroke-width="2" cx="450" cy="375" r="5"/>
  <circle fill="#24C1E0" stroke="#21A2BF" stroke-width="2" cx="525" cy="245" r="5"/>
  <circle fill="#24C1E0" stroke="#21A2BF" stroke-width="2" cx="600" cy="275" r="5"/>
  <circle fill="#24C1E0" stroke="#21A2BF" stroke-width="2" cx="675" cy="135" r="5"/>
</svg>
Javascript:
//插入Y軸刻度
for(var i=100;i<=500; i=i+50){
  var svgNode = document.createElementNS("http://www.w3.org/2000/svg", "line");
  svgNode = $(svgNode);
  svgNode.attr({
    x1: 100,
    y1: i,
    x2: 110,
    y2: i,
    stroke:"gray"
  });
  $("#svgBarChart").append(svgNode);
}
