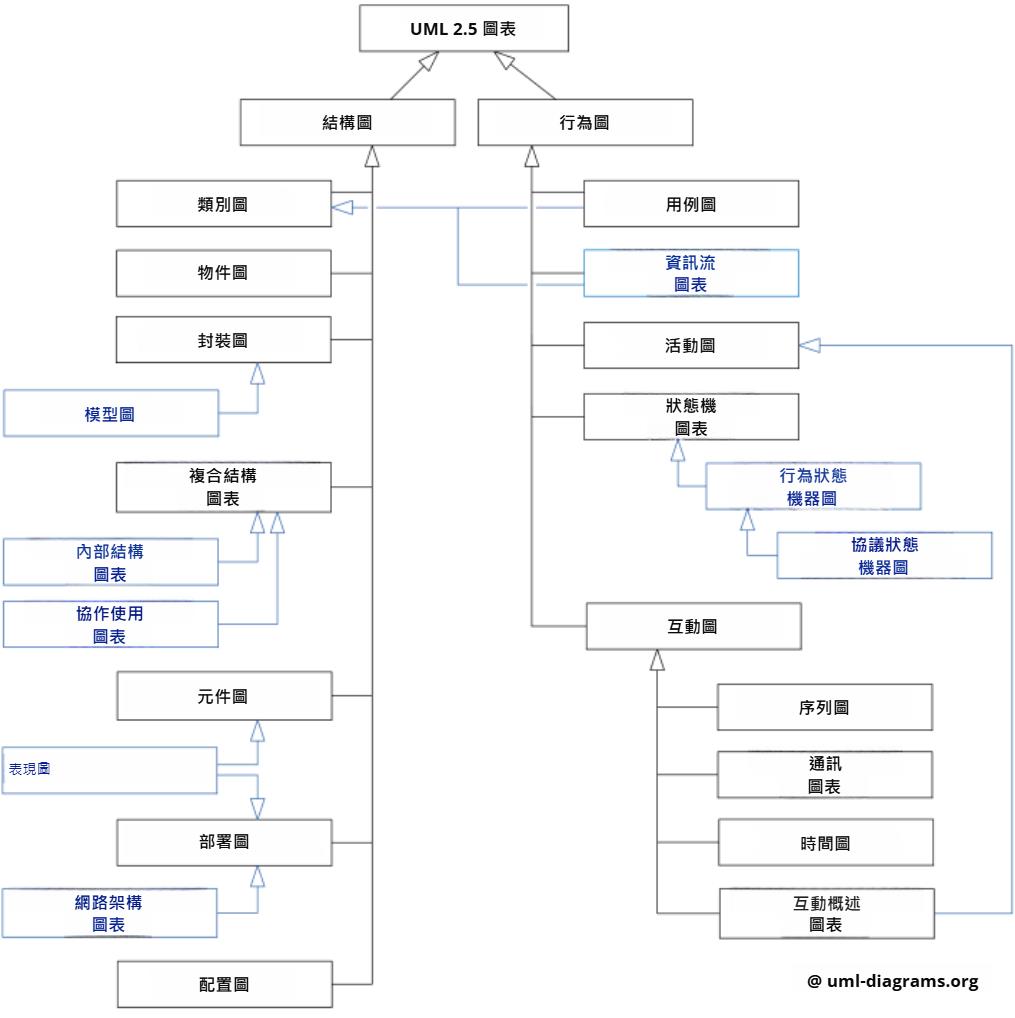
UML(統一建模語言)圖表是系統設計、實現或已存在系統模型的部分圖形表示(視圖)。UML 圖表包含圖形元素(符號),這些符號是 UML 節點,並通過邊(也稱為路徑或流)連接,表示設計系統的 UML 模型中的元素。系統的 UML 模型還可能包含其他文檔,例如以模板文本編寫的用例。
圖表的類型由其內容區域中的主要圖形符號定義。例如,主要符號是類的圖表是類圖。顯示用例和參與者的圖表是用例圖。序列圖顯示生命線之間的消息交換序列。
UML 規範不排除混合不同類型的圖表,例如將結構和行為元素結合起來,顯示嵌套在用例內的狀態機。因此,各種圖表之間的界限並不嚴格執行。同時,一些 UML 工具確實限制了在特定類型的圖表上可用的圖形元素集123.
UML 2.5 圖表的分類
UML 規範定義了兩大類 UML 圖表:結構圖和行為圖。

結構圖顯示系統及其各部分在不同抽象和實現層次上的靜態結構,以及它們之間的關係。結構圖中的元素表示系統的有意義概念,並且可能包括抽象概念、現實世界概念和實現概念。
行為圖顯示系統中對象的動態行為,這可以描述為系統隨時間變化的一系列變化。
UML 2.5 圖表可以分層分類,如下所示。請注意,以藍色顯示的項目不屬於 UML 2.5 圖表的官方分類。
結構圖
- 類圖:顯示系統中的類及其關係42.
- 對象圖:顯示特定時間點的對象及其關係4.
- 包圖:顯示系統的包及其依賴關係4.
- 模型圖:顯示系統的高層次結構4.
- 組合結構圖:顯示類的內部結構4.
- 內部結構圖:顯示類或組件的內部結構4.
- 協作用例圖:顯示用例之間的協作4.
- 組件圖:顯示系統的組件及其依賴關係4.
- 實現圖:顯示系統的實現詳細信息4.
- 網絡架構圖:顯示系統的網絡架構4.
- 配置圖:顯示系統的物理配置4.
行為圖
- 用例圖:顯示系統的功能需求4.
- 信息流圖:顯示系統中的信息流4.
- 活動圖:顯示系統中的活動流4.
- 狀態機圖:顯示對象的狀態及其轉換4.
- 行為狀態機圖:顯示行為的狀態及其轉換4.
- 協議狀態機圖:顯示協議的狀態及其轉換4.
- 交互圖:顯示對象之間的交互4.
- 序列圖:顯示對象之間的消息交換序列4.
- 通信圖:顯示對象之間的消息交換4.
- 時序圖:顯示對象的時間約束4.
- 交互概述圖:顯示交互的概述4.
結論
UML 2.5 圖表提供了一種強大的工具,用於視覺表示和理解複雜系統的結構和行為。通過結構圖和行為圖,設計人員和開發人員可以有效地捕捉和傳達系統的各個方面,從高層次概念到詳細實現。理解這些圖表及其分類對於任何從事系統設計和開發的專業人員都是至關重要的152367.
UML 2.5 Diagrams Overview
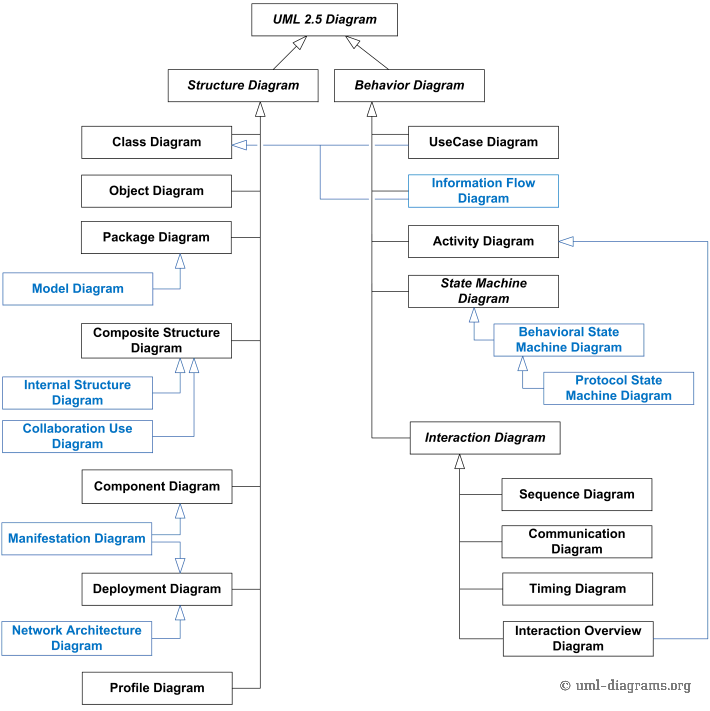
UML (Unified Modeling Language) diagrams provide a partial graphical representation (view) of a model of a system under design, implementation, or already in existence. A UML diagram contains graphical elements (symbols)—UML nodes connected with edges (also known as paths or flows)—that represent elements in the UML model of the designed system. The UML model of the system might also contain other documentation, such as use cases written as templated texts.
The type of diagram is defined by the primary graphical symbols shown in the diagram. For example, a diagram where the primary symbols in the contents area are classes is a class diagram. A diagram that shows use cases and actors is a use case diagram. A sequence diagram shows the sequence of message exchanges between lifelines.
The UML specification does not preclude mixing different kinds of diagrams, e.g., to combine structural and behavioral elements to show a state machine nested inside a use case. Consequently, the boundaries between the various kinds of diagrams are not strictly enforced. At the same time, some UML tools do restrict the set of available graphical elements that could be used when working on a specific type of diagram123.
Classification of UML 2.5 Diagrams
The UML specification defines two major kinds of UML diagrams: structure diagrams and behavior diagrams.

Structure Diagrams show the static structure of the system and its parts on different abstraction and implementation levels and how they are related to each other. The elements in a structure diagram represent the meaningful concepts of a system and may include abstract, real-world, and implementation concepts.
Behavior Diagrams show the dynamic behavior of the objects in a system, which can be described as a series of changes to the system over time.
UML 2.5 diagrams can be categorized hierarchically as shown below. Note that items shown in blue are not part of the official UML 2.5 taxonomy of diagrams.
Structure Diagrams
- Class Diagram: Shows the system's classes and their relationships42.
- Object Diagram: Shows a snapshot of the detailed state of a system at a point in time4.
- Package Diagram: Shows the dependencies between packages that make up a model4.
- Model Diagram: Shows the high-level structure of a system4.
- Composite Structure Diagram: Shows the internal structure of a class and its interactions with the environment through ports4.
- Internal Structure Diagram: Shows the internal structure of a classifier, including its parts and connectors4.
- Collaboration Use Diagram: Shows a set of use cases and their relationships4.
- Component Diagram: Shows the organization and dependencies among a set of components4.
- Deployment Diagram: Shows the configuration of run-time processing nodes and the components that live on them4.
- Network Architecture Diagram: Shows the network architecture of a system4.
- Profile Diagram: Shows customizations of a model for specific platforms or domains4.
Behavior Diagrams
- Use Case Diagram: Shows the functionality provided by a system and its relationships with external actors4.
- Information Flow Diagram: Shows the flow of information within a system4.
- Activity Diagram: Shows the flow of control in a system4.
- State Machine Diagram: Shows the states of an object and the transitions between those states4.
- Behavioral State Machine Diagram: Shows the states of a behavior and the transitions between those states4.
- Protocol State Machine Diagram: Shows the states of a protocol and the transitions between those states4.
- Interaction Diagram: Shows the interactions between objects in terms of sequenced messages4.
- Sequence Diagram: Shows how objects interact in a particular scenario of a use case4.
- Communication Diagram: Shows the interactions between objects in terms of sequenced messages4.
- Timing Diagram: Shows the timing constraints on interactions4.
- Interaction Overview Diagram: Shows an overview of the interactions in a system4.
Conclusion
UML 2.5 diagrams provide a powerful tool for visually representing and understanding the structure and behavior of complex systems. Through structure and behavior diagrams, designers and developers can effectively capture and communicate various aspects of a system, from high-level concepts to detailed implementations. Understanding these diagrams and their classifications is crucial for anyone involved in system design and development152367.