魚骨圖(Fishbone Diagram),又稱 Ishikawa 圖 或 因果圖,是一種強大的可視化工具,用於執行 根本原因分析(Root Cause Analysis, RCA)。它協助團隊系統性地探討並可視化特定問題(「結果」)的潛在原因,以結構化方式呈現。
什麼是魚骨圖?
圖形類似魚骨:
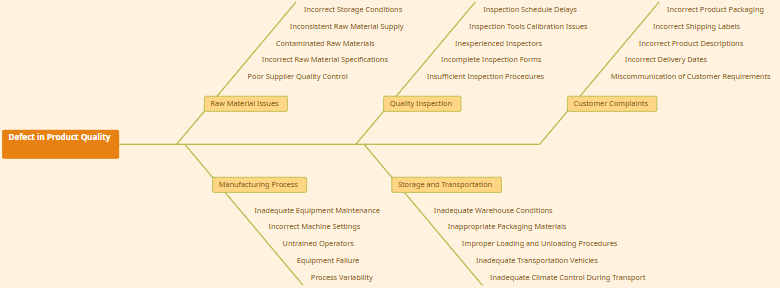
- 頭部(魚頭): 代表問題或結果。
- 主軸(魚骨主幹): 連接頭部的水平線。
- 分支(魚骨主幹): 代表主要的因果分類(例如:6M 框架)。
- 子分支(細骨): 具體的根因。
🧩 常見的「6M」分類框架:
| 分類 | 含義 |
|---|---|
| 人(Man) | 人力、技能、知識、疲勞 |
| 機器(Machine) | 設備、工具、技術 |
| 方法(Method) | 流程、程序、標準 |
| 材質(Material) | 原料、供應品、組件 |
| 量測(Measurement) | 數據收集、指標、準確性 |
| 環境(Mother Nature / Environment) | 氣候、地點、外部環境 |
💡 可依情境自訂分類 — 例如:「人員、流程、平台、政策」適用於軟體開發。
🌐 為何在 OpenDocs 中使用魚骨圖?
OpenDocs 是 Visual Paradigm 的 AI 驅動知識管理平台,整合文件編輯、圖表繪製與智慧內容生成於一體。
自 2026年2月2日 起,正式支援魚骨圖功能,團隊可於文件環境中直接進行 深度根本原因分析,大幅提升問題解決效率。
✅ 在 OpenDocs 中使用魚骨圖的優勢:
| 優勢 | 說明 |
|---|---|
| 整合式工作流程 | 無需切換工具 — 在同一環境中完成分析、文件編輯與行動規劃。 |
| 內嵌於文件中 | 可將圖表插入 Markdown 文件,支援技術文件、事件回顧或專案總結。 |
| 知識集中管理 | 所有 RCA 資料(圖表、筆記、行動項目)皆儲存於同一「空間」(Space),便於追蹤與共用。 |
| AI 輔助功能 | 使用 AI 產生摘要、建議可能原因、或自動整理內容。 |
| 跨工具整合 | 可搭配思維圖、時間軸、流程圖等,進行全方位分析。 |
🛠️ 適用對象:品質工程師、DevOps 團隊、專案經理、產品經理、流程改進專員。
📋 使用條件
使用 OpenDocs 中的魚骨圖,需符合下列條件:
| 條件 | 說明 |
|---|---|
| 版本 | Visual Paradigm Desktop Professional 或 Visual Paradigm Online Combo |
| 存取方式 | 使用授權工作區登入:https://ai.visual-paradigm.com/tool/opendocs/ |
| 功能上線日期 | 2026年2月2日(v2026.1+) |
| 匯出格式 | 支援 PNG、SVG、PDF;可嵌入 Markdown 文件 |
⚠️ 注意:基礎版本 不支援 魚骨圖功能。請升級至專業版以使用。
🛠️ 如何在 OpenDocs 中建立魚骨圖?
OpenDocs 提供 兩種整合模式,適用於不同使用情境。
📌 方法一:內嵌於文件頁面(情境整合)
適用於將根本原因分析融入報告、事件回顧或專案文件中。
✅ 步驟:
- 開啟您在 OpenDocs 中的 既有的文件頁面(例如:專案總結或事件回顧)。
- 點選右上角的 編輯 按鈕。
- 將游標定位於 Markdown 編輯器 中,欲插入圖表的位置。
- 點選底部工具列的 插入 按鈕。
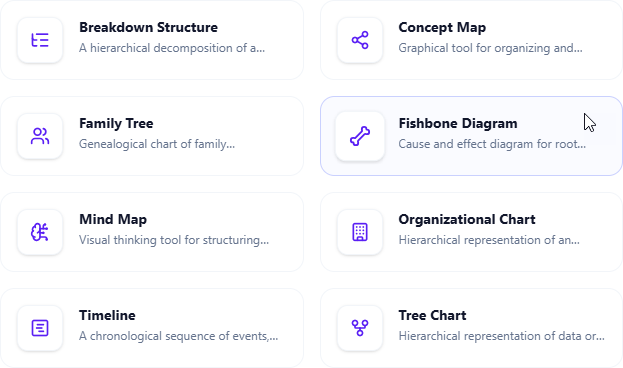
- 從選單中選擇:
➤ 思維圖 > 魚骨圖 - 魚骨圖編輯器即刻開啟。
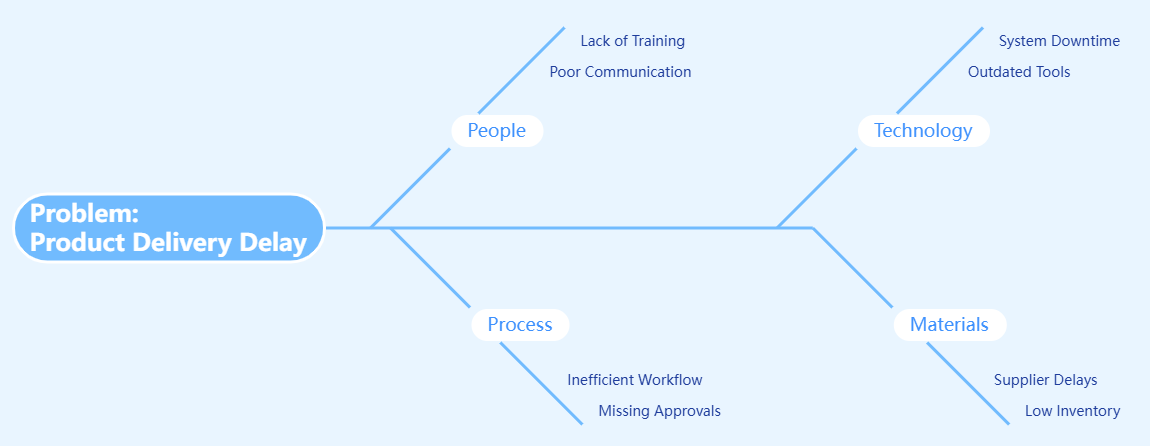
- 開始建立:
- 在 頭部 輸入問題陳述(例如:「Q1 專案交付延遲 30%」)。
- 加入 主要分類 作為分支(例如:人、機器、方法)。
- 擴展每支為 具體原因(例如:「缺乏訓練」、「舊版軟體」)。
- 使用 拖曳功能 重新排列分支。
- 自訂:
- 顏色
- 字型
- 連線樣式
- 圖示(由 AI 提供建議)
- 點選 儲存(右上角)→ 關閉編輯器。
- 圖表會 內嵌於文字中,便於審閱與分享。
📝 提示:可將此圖表連結至行動項目、時間軸或風險登記表。
📌 方法二:建立獨立元件頁面(專責分析)
適用於深度分析、團隊研討會或獨立的 RCA 文件。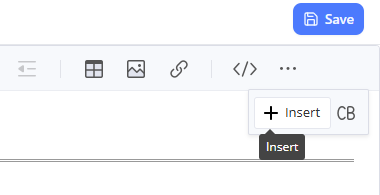
✅ 步驟:
- 在 目錄窗格(側邊欄)點選頂端的 + 按鈕。
- 選取 新增元件頁面。
- 選擇 思維圖 > 魚骨圖。
- 編輯器以 全螢幕模式 開啟。
- 建立圖表:
- 在頭部定義 結果。
- 加入 主要因果分類。
- 使用腦力激盪,深入探討 具體根本原因。
- 使用 AI 助手(底部面板):
- 推薦遺漏的分類
- 產生可能原因範例
- 產生分析總結
- 產生可視化圖像
- 完成後,點選 儲存(右上角)。
- 圖表將以 獨立頁面 儲存,並自動出現在您的空間中。
🔗 後續可使用
[魚骨圖:專案延遲]連結至其他文件。
🎯 根本原因分析的最佳實務
| 實務 | 理由 |
|---|---|
| 1. 清晰定義問題 | 使用 SMART 準則:具體、可衡量、可達成、相關、時限明確。例如:「一月有 40% 的使用者無法完成註冊。」 |
| 2. 選擇合適的分類框架 | 使用 6M 或依產業調整(如:4P:人員、流程、產品、價格)。 |
| 3. 協同腦力激盪 | 邀請跨職能成員參與。使用 OpenDocs 的 即時編輯 與 回覆串 功能收集意見。 |
| 4. 搭配「五次為什麼」技術 | 對每項原因重複提問「為什麼?」直到找到根本原因(例如:為何系統當機?→ 因伺服器崩潰。為何?→ 因記憶體不足...)。 |
| 5. 標示高風險原因 | 使用投票、影響/機率矩陣或 AI 幫助評分。 |
| 6. 連結至行動計畫 | 從分析中建立任務。使用 AI 產生 矯正行動計畫。 |
| 7. 定期檢視與迭代 | 當修正措施實施後,重新檢視圖表,更新資訊。 |
🔄 提示:結合 思維圖 用於發想,時間軸 用於追蹤解決進度。
🚀 OpenDocs 的額外功能升級
OpenDocs 不只是圖表工具,更是一個 智慧知識生態系。
🔧 AI 輔助功能:
- 自動建議原因:AI 根據問題陳述推薦可能原因。
- 產生摘要:自動產出魚骨圖分析摘要。
- 生成視覺圖像:使用 AI 產生圖示或美化的圖表版本。
- 自動整理空間:AI 可協助分類與組織文件結構。
🔄 無縫整合:
- 可嵌入於 Markdown 文件、技術文件、路線圖 或 事件回顧報告。
- 可連結至 行動項目、風險清單 或 KPI 儀錶板。
- 透過安全連結分享整個 空間(Space),適用於稽核、管理階層檢視或新人訓練。
📊 支援的其他圖表類型(v2026.1+):
- 思維圖
- 魚骨圖
- 時間軸
- 流程圖
- 組織圖
- Gantt 圖
- SWOT 分析
- Kanban 看板
- 決策樹
💬 整合使用這些工具,建立完整的問題解決工作流程。
📌 終極建議與實用技巧
- 使用顏色編碼:為不同分類設定顏色(例如:紅色代表高風險,黃色代表中等)。
- 限制分支數量:保持主要分類在 5–7 個,避免過於雜亂。
- 使用 AI 驗證:提問:「這個魚骨圖有遺漏的可能原因嗎?」
- 匯出用於簡報:匯出為 PNG/SVG,插入 PowerPoint 或 Confluence。
- 歸檔已完成圖表:將完成的魚骨圖移至「歷史 RCA」資料夾。
📣 開始使用吧!
🚀 提升問題解決效率,讓根本原因分析更智慧、更整合。
🔗 立即開始:
- 前往 OpenDocs 首頁:https://ai.visual-paradigm.com/tool/opendocs/
- 探索 魚骨圖範本圖庫(OpenDocs > 範本)
- 加入 社群論壇 取得範本與技巧
📚 更多資訊:
- 閱讀官方公告:https://updates.visual-paradigm.com/releases/fishbone-diagram-root-cause-analysis-opendocs/
- 觀看 5 分鐘操作影片(OpenDocs > 助手中心)
🏁 結論
自 2026年2月2日 起,OpenDocs 正式支援 魚骨圖功能,根本原因分析不再是獨立作業,而是 文件工作流程的一部分。
結合 結構化腦力激盪、即時協作 與 AI 輔助分析,OpenDocs 讓團隊能:
- 更快速解決問題
- 更清楚文件分析結果
- 更有信心執行行動
🎯 停止猜測。開始分析。文件一切。
References
- AI Fishbone Diagram Generator: This page introduces a purpose-built AI tool that automatically generates Fishbone (Ishikawa) diagrams from simple text descriptions to help identify the root causes of complex problems.
- AI-Powered Fishbone Diagram Generator – Uncover Root Causes in Seconds: An article exploring how AI-driven automation accelerates the creation of fishbone diagrams, streamlining decision-making and root cause analysis workflows.
- Create Fishbone Diagrams from Text Using Visual Paradigm Smart Board: This free guide demonstrates how to use the Smart Board feature to transform natural language text input directly into structured cause-and-effect diagrams.
- Fishbone Analysis: Ishikawa Diagram Concepts and AI-Powered Tools: A detailed case study that explores the fundamental concepts of Ishikawa diagrams and highlights the transformative role of AI-powered tools like Visual Paradigm in modern analysis.
- Announcement: AI Fishbone Diagram Generator Launch: Official release notes detailing the launch of the platform's specialized AI generator designed to simplify technical problem-solving through automated modeling.
- AI Chart Generator | Create Stunning Charts with AI: A resource explaining how the AI Fishbone Diagram Generator sits alongside other automated tools to help users visualize ideas and improve overall workflow efficiency.
- Unraveling Complex Issues: The Power of Cause and Effect Analysis with Fishbone Diagrams: A comprehensive guide explaining how structured analysis using these diagrams helps solve business and operational problems by organizing AI-driven insights.
- How to Create a Fishbone Diagram: A Step-by-Step Guide: A tutorial that teaches the core methodology for building these diagrams, which provides the foundation for using the platform’s AI-assisted creation tools.
- Free Fishbone Diagram Tool – Create Diagrams Instantly: An overview of the web-based, collaborative environment where users can leverage AI capabilities to build professional fishbone diagrams without manual drawing.
- Visualizing Complex Ideas with AI-Powered Tree Diagrams: This resource explores how generative AI helps teams break down intricate concepts into structured visual representations, including hierarchical formats similar to fishbone structures.