這一篇要介紹構成圖表的三個要素:座標系(Chart Control)、座標軸(Axes)和點序列(Series)。
在 Live Charts 裡,要構成一個圖表主要包含三大部分:
- Chart Control:這個控制項主要控制座標系,有最常用的 XY 笛卡爾座標系、圓餅圖、極座標圓餅圖和地理圖等;也可以把它視為是圖表的畫布。
- Axes:定義 X座標與Y座標,用於笛卡爾座標系 Chart Control。
- Series:定義要繪圖的資料點序列,例如折線圖、長條圖、K線圖等等。
Cartesian chart control
笛卡爾座標系所使用的控制項, CartesianChart 類別。所有相關於 XY 座標系的處理都已經包含在這邊,這意思就是說當你要畫圖表的時候,只須關注在圖表本身 XY 軸的資料定義 (Coordinates),毋須處理實際繪圖的座標點(Position)。
Axes
座標軸相關定義,CartesianChart.XAexs property 與 CartesianChart.YAexs property,型別為 IEnumerable<IAxis> ,一些關於 Zooming、Panning、Scale 和 Paging 等等的操作會和座標軸有關。
Series
定義圖形的序列點 CartesianChart.Series property 型別為 IEnumerable<ISeries>,在當前的版本中 XY 座標系可使用的 Series 有以下幾種:Line series (折線圖)、Column series (長條圖)、Scatter series (散布圖)、Step line series (階梯圖)、Heat Series (熱圖)、Candle sticks series (K線圖)、Stacked line series (堆疊折線圖)、Stacked column series (堆疊長條圖)、Stacked step line series (堆疊階梯圖)。有點讓我意外的是原有的 OHLC series (開高低收圖,另稱美國線) 居然不見了,不過現在還是 beta,也許到了正式版會出現。
以下來個範例玩玩看,首先建立好 View Model:
public class MainViewModel : NotifyPropertyBase
{
private ObservableCollection<ISeries> _series;
private ObservableCollection<Axis> _xAxes;
private ObservableCollection<Axis> _yAxes;
public ObservableCollection<ISeries> Series
{
get => _series;
set => SetProperty(ref _series, value);
}
public ObservableCollection<Axis> XAxes
{
get => _xAxes;
set => SetProperty(ref _xAxes, value);
}
public ObservableCollection<Axis> YAxes
{
get => _yAxes;
set => SetProperty(ref _yAxes, value);
}
public MainViewModel()
{
Series = new ObservableCollection<ISeries>
{
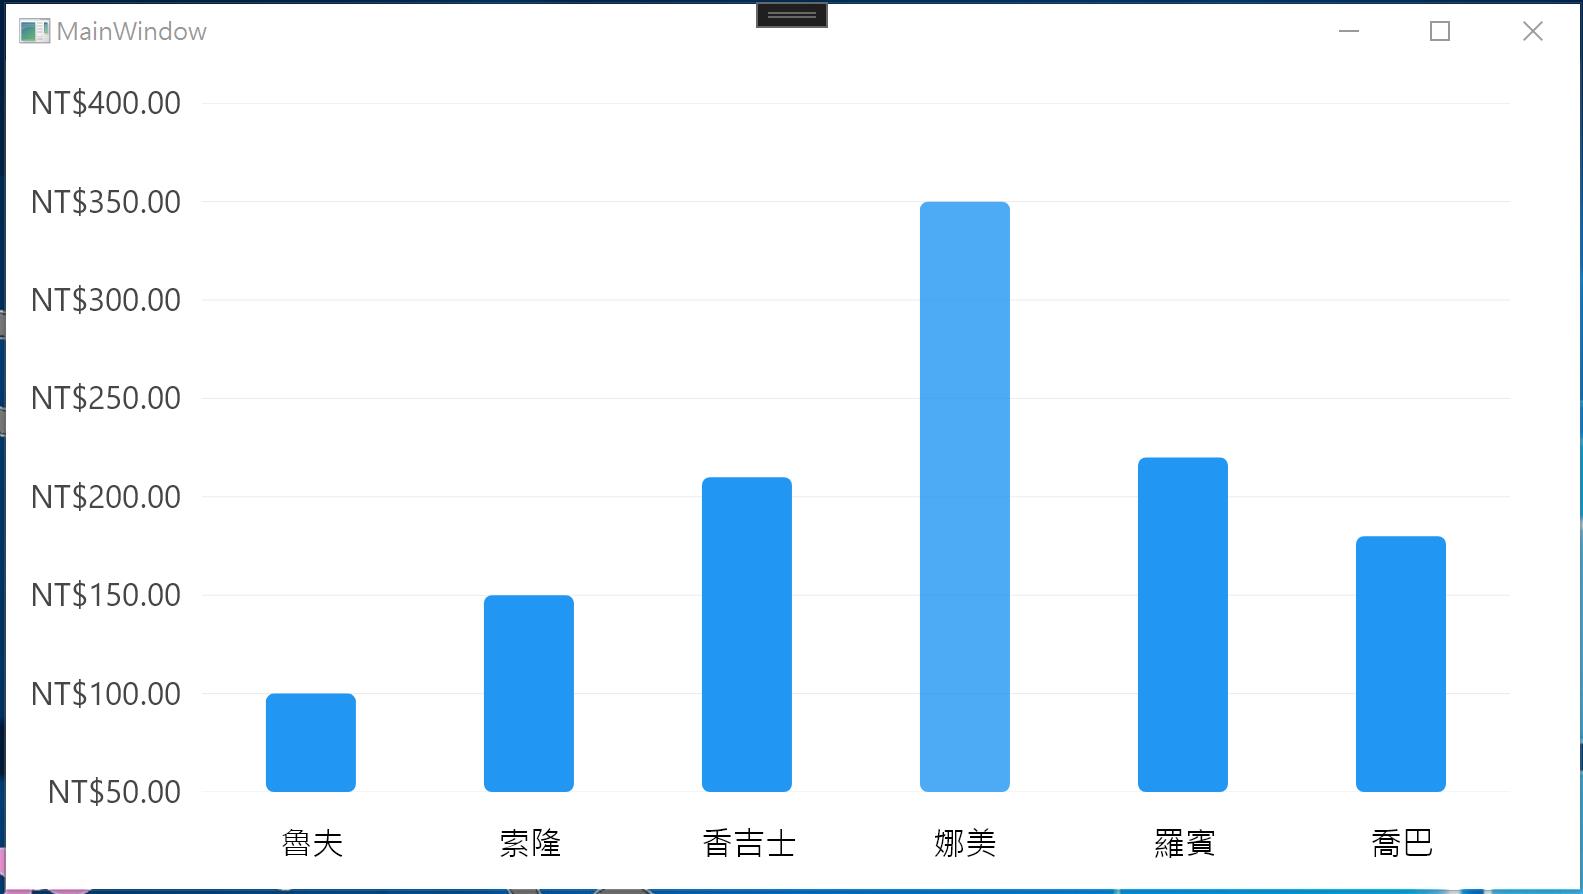
new ColumnSeries<int> {Values = new ObservableCollection<int> { 100, 150, 210, 350, 220, 180 } },
};
XAxes = new ObservableCollection<Axis>
{
new Axis
{
Labels =new ObservableCollection<string> { "魯夫", "索隆" , "香吉士", "娜美", "羅賓", "喬巴" },
LabelsPaint = new SolidColorPaint
{
Color = SKColors.Black ,
SKTypeface = SKFontManager.Default.MatchCharacter ('繁'),
}
}
};
YAxes = new ObservableCollection<Axis>
{
new Axis{ Labeler = (x) => $"{x:C}" },
};
}
}這邊有幾件事情要解釋:
- View Model 中的 XAxes 屬性會繫結到 CartesianChart.XAxes 屬性,藉以定義 X 軸,Label 屬性則是定義 X 軸上每個基準點要顯示的字串。
- 因為我們的 Label 是繁體中文,所以在 XAxes 屬性要定義 LablesPaint, 這表示了在非英語系的顯示方面會需要額外的處理;這需要藉由設定 LabelsPaint.SkTypeface 來使得它能夠「畫」出中文來。範例中用了 SKTypeface = SKFontManager.Default.MatchCharacter ('繁') ,這個寫法覺得好神奇,只要隨便擺個繁體中文字元,它就會找到對應的字型;其實也可以用另一個寫法是用 font family,例如: SKTypeface = SKFontManager.Default.MatchFamily ("新細明體"),感覺這看起來比較好想像。
- 在 YAxes 上用的 Labeler 屬性型別是 Func<double,string>,這功能其實就是用來做 double 轉字串的格式化,它留了個委派讓你可以寬廣地自行定義。
Xaml 的部分就簡單了,全部繫結上去就對了:
<Window x:Class="LiveChartsV2Sample002.MainWindow"
        xmlns="http://schemas.microsoft.com/winfx/2006/xaml/presentation"
        xmlns:x="http://schemas.microsoft.com/winfx/2006/xaml"
        xmlns:d="http://schemas.microsoft.com/expression/blend/2008"
        xmlns:mc="http://schemas.openxmlformats.org/markup-compatibility/2006"
        xmlns:lvc="clr-namespace:LiveChartsCore.SkiaSharpView.WPF;assembly=LiveChartsCore.SkiaSharpView.WPF"
        xmlns:local="clr-namespace:LiveChartsV2Sample002"
        mc:Ignorable="d"
        Title="MainWindow" Height="450" Width="800">
    <Window.DataContext>
        <local:MainViewModel/>
    </Window.DataContext>
    <Grid>
        <lvc:CartesianChart Series="{Binding Series}"
                            XAxes="{Binding XAxes}"
                            YAxes="{Binding YAxes}"/>
    </Grid>
</Window>
完成後的畫面:
這一篇的範例程式在此。