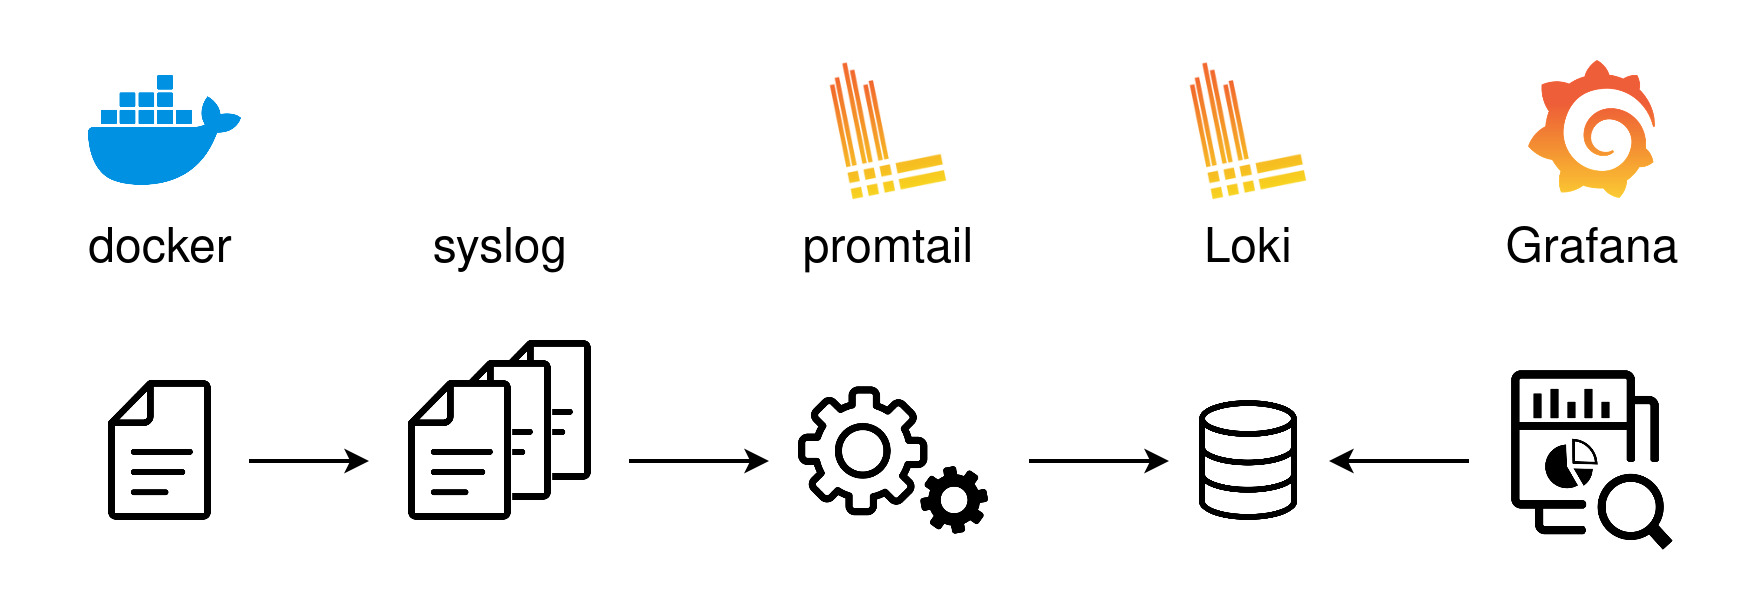
Loki 是由 Grafana Labs 開發的一款日誌系統,除了透過 http 接收 log 之外,還可以用 promtail 收集器接收、分析 log,最終,再透過 Grafana Dashboard 呈現。
下圖出自:How to setup Grafana, Loki and promtail for monitoring docker — Quentin Favrie
開發環境
- Windows 11 home
- Rider 2024.3.3
- ASP.NET Core 8
- Docker 27.2.0
- loki 3.1.2
- promtail 3.1.2
- grafana 11.4.0
使用 Serilog.Sinks.Grafana.Loki 發送訊息
開啟 Web API .NET 8 專案,安裝以下套件
dotnet add package Serilog.Sinks.Seq --version 8.0.0dotnet add package Serilog.AspNetCore --version 8.0.3dotnet add package Serilog.Sinks.Grafana.Loki --version 8.3.0
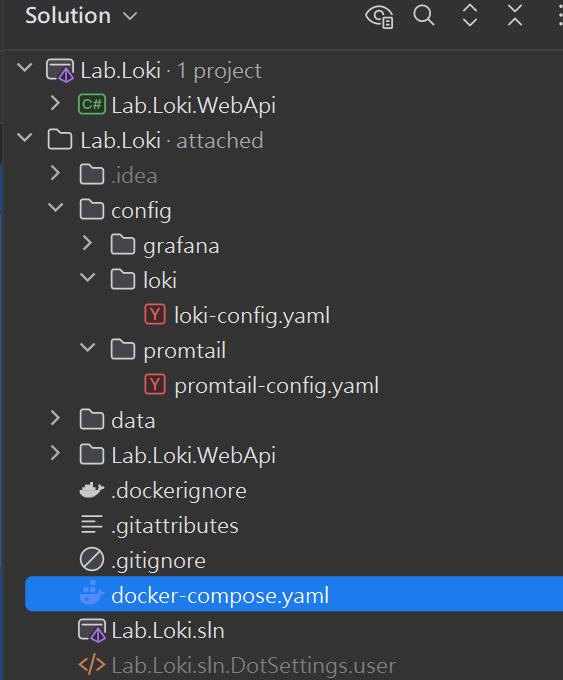
專案結構
docker-compose.yaml 內容如下
version: "3"

networks:
  loki:
    driver: bridge

services:
  loki:
    image: grafana/loki:3.1.2
    ports:
      - "3100:3100"
    volumes:
      - ./config/loki:/etc/loki
    command: -config.file=/etc/loki/loki-config.yaml  # 修正配置檔名稱
    networks:
      - loki

  grafana:
    image: grafana/grafana:11.4.0
    volumes:
      - ./data/grafana:/var/lib/grafana
      - ./config/grafana/provisioning:/etc/grafana/provisioning  # 添加 provisioning 映射
    environment:
      - GF_PATHS_PROVISIONING=/etc/grafana/provisioning
      - GF_AUTH_ANONYMOUS_ENABLED=true
      - GF_AUTH_ANONYMOUS_ORG_ROLE=Admin
    ports:
      - "3000:3000"
    depends_on:
      - loki
    networks:
      - loki
./config/loki/loki-config.yaml 內容如下
auth_enabled: false

server:
  http_listen_port: 3100
  grpc_listen_port: 9096

common:
  instance_addr: 127.0.0.1
  path_prefix: /tmp/loki
  storage:
    filesystem:
      chunks_directory: /tmp/loki/chunks
      rules_directory: /tmp/loki/rules
  replication_factor: 1
  ring:
    kvstore:
      store: inmemory

limits_config:
  volume_enabled: true
  ingestion_rate_mb: 32
  ingestion_burst_size_mb: 64
  max_global_streams_per_user: 5000
  max_query_length: 721h
  max_query_parallelism: 32
  max_streams_per_user: 0
  reject_old_samples: true
  reject_old_samples_max_age: 168h
  retention_period: 744h

query_range:
  results_cache:
    cache:
      embedded_cache:
        enabled: true
        max_size_mb: 100

schema_config:
  configs:
    - from: 2020-10-24
      store: tsdb
      object_store: filesystem
      schema: v13
      index:
        prefix: index_
        period: 24h

ruler:
  alertmanager_url: http://localhost:9093

# By default, Loki will send anonymous, but uniquely-identifiable usage and configuration
# analytics to Grafana Labs. These statistics are sent to https://stats.grafana.org/
#
# Statistics help us better understand how Loki is used, and they show us performance
# levels for most users. This helps us prioritize features and documentation.
# For more information on what's sent, look at
# https://github.com/grafana/loki/blob/main/pkg/analytics/stats.go
# Refer to the buildReport method to see what goes into a report.
#
# If you would like to disable reporting, uncomment the following lines:
#analytics:
#  reporting_enabled: false
./config/grafana/provisioning/datasources/loki.yaml 內容如下
apiVersion: 1
datasources:
  - name: Loki
    type: loki
    access: proxy
    url: http://loki:3100
    jsonData:
      maxLines: 1000
    editable: true
把服務掛起來
docker compose up -d
配置 Serilog
在 Program.cs,LoggerConfiguration.WriteTo.GrafanaLoki(),遠端的 GrafanaLoki 這裡使用 "http://localhost:3100",若是使用 Docker Container,記得改成 "http://loki:3100"
var formatter = new CompactJsonFormatter();
Log.Logger = new LoggerConfiguration()
    .MinimumLevel.Information()
    .MinimumLevel.Override("Microsoft.AspNetCore", LogEventLevel.Warning)
    .Enrich.FromLogContext()
    .WriteTo.Console(formatter)                                                         // 使用 JSON 格式輸出
    .WriteTo.File(formatter, "logs/aspnet-.txt", rollingInterval: RollingInterval.Hour) //正式環境不要用 File
    .WriteTo.Seq("http://localhost:5341", payloadFormatter: formatter)
    .WriteTo.GrafanaLoki( "http://localhost:3100",
        labels: new[] {
            new LokiLabel { Key = "service", Value = "api" }
        },
        credentials: null,
        propertiesAsLabels: new[] { "RequestId", "RequestPath", "StatusCode" }
    )
    .CreateBootstrapLogger();
Log.Information("Starting web host");
var builder = WebApplication.CreateBuilder(args);

// Add services to the container.
builder.Services.AddControllers();
builder.Host.UseSerilog();
二階段初始化
- LoggerConfiguration.CreateBootstrapLogger
- builder.Host.UseSerilog()
在 Controller 依賴 ILogger<MemberV1Controller> 即可寫入 log
[ApiController]
public class MemberV1Controller(ILogger<MemberV1Controller> log) : ControllerBase
{
    private ILogger<MemberV1Controller> _log = log;
    [HttpGet]
    [Route("api/v1/members", Name = "GetMember")]
    public async Task<ActionResult> GetMemberCursor(
        CancellationToken cancel = default)
    {
        log.LogInformation("OKK");
        log.LogInformation(
            "API Request completed {@RequestDetails}",
            new
            {
                Path = Request.Path,
                Method = Request.Method,
                StatusCode = Response.StatusCode,

                // Duration = stopwatch.ElapsedMilliseconds
            });
        log.LogError(2000, new Exception("完蛋了!!!"), "慘了");
        log.LogCritical(2001, new Exception("完蛋了!!!"), "慘了");
        log.LogWarning(3000, "警告");
        log.LogTrace(3001, "追蹤");
        log.LogDebug(3002, "除錯");
        return this.Ok();
    }
}
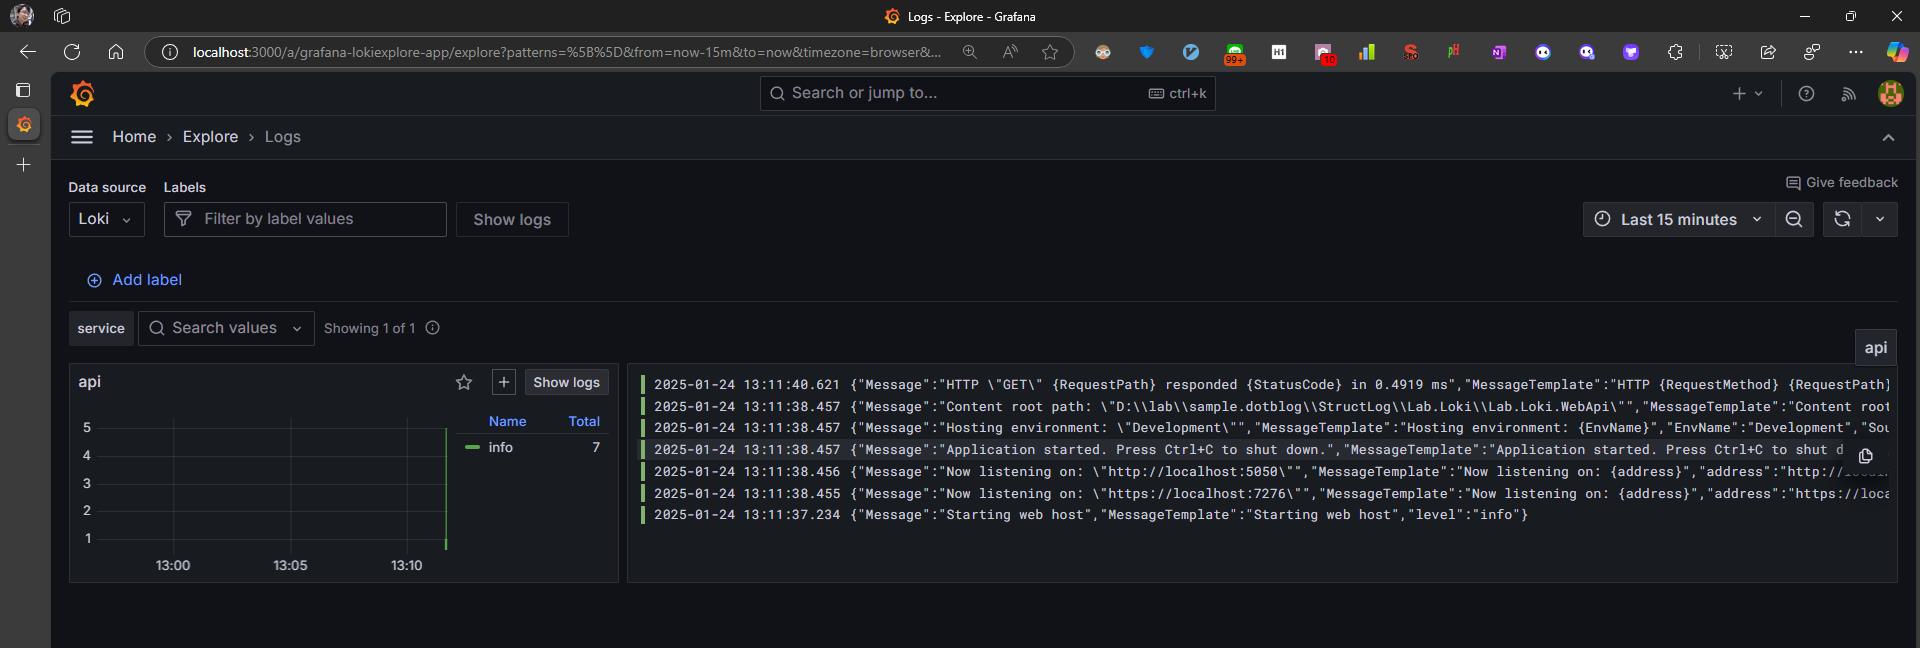
啟動 Web API,再訪問 Grafana (http://localhost:3000/)就可以接收到 Loki 傳過來的 log
用 Promtail 收集 Container 的 Console Output
./config/promtail/promtail-config.yaml 內容如下
server:
  http_listen_port: 9080
  grpc_listen_port: 0

positions:
  filename: /tmp/positions.yaml

clients:
  - url: http://loki:3100/loki/api/v1/push

scrape_configs:
  - job_name: docker
    docker_sd_configs:
      - host: unix:///var/run/docker.sock
        refresh_interval: 5s
    relabel_configs:
      - source_labels: [ '__meta_docker_container_name' ]
        regex: '/(.*)'
        target_label: 'container'
      - source_labels: [ '__meta_docker_container_id' ]
        target_label: 'container_id'
      - source_labels: [ '__meta_docker_container_log_stream' ]
        target_label: 'stream'
      - action: replace
        target_label: job
        replacement: container-logs
    pipeline_stages:
      #- docker: { }
      - labels:
          job: container-logs
      - timestamp:
          source: time
          format: RFC3339Nano
      - output:
          source: message
          format: "Input line: {{ .line }}"

  - job_name: api-log
    docker_sd_configs:
      - host: unix:///var/run/docker.sock
        refresh_interval: 5s
    relabel_configs:
      - source_labels: [ '__meta_docker_container_name' ]
        regex: '/(.*)'
        target_label: 'container'
      # 只保留符合特定名稱模式的容器
      - source_labels: [ '__meta_docker_container_name' ]
        # 只收集名稱包含 'api' 的容器
        regex: '/?api.*'
        # 保留符合條件的容器,過濾掉其他的
        action: keep
      #- action: replace
      #  target_label: job
      #  replacement: api-logs
    pipeline_stages:
      # JSON 解析階段
      - json:
          # 從 JSON 日誌中提取特定字段
          expressions:
            RequestId: RequestId
            RequestPath: RequestPath
            StatusCode: StatusCode
            #Level: level
      # 將提取的字段設置為標籤
      - labels:
          #job: api-logs
          RequestId:
          RequestPath:
          StatusCode:
          #Level:
      - timestamp:
          source: time
          format: RFC3339Nano
      - output:
          source: message
          format: "Input line: {{ .line }}"
docker-compose.yaml 補上 api 跟 promtail
version: "3"

networks:
  loki:
    driver: bridge

services:
  api:
    build:
      context: .
      dockerfile: Lab.Loki.WebApi/Dockerfile
    ports:
      - "8080:8080"
    #labels:
    #  logging: "promtail-be-job-nest"
    #logging:
    #  driver: json-file
    #  options:
    #    max-size: "10m"
    #    max-file: "3"
    environment:
      - ASPNETCORE_ENVIRONMENT=Development
    networks:
      - loki

  seq:
    image: datalust/seq:latest
    ports:
      - "5341:5341"
    environment:
      - ACCEPT_EULA=Y

  loki:
    image: grafana/loki:3.1.2
    ports:
      - "3100:3100"
    volumes:
      - ./config/loki:/etc/loki
    command: -config.file=/etc/loki/loki-config.yaml  # 修正配置檔名稱
    networks:
      - loki

  promtail:
    image: grafana/promtail:3.1.2
    volumes:
      - /var/log:/var/log
      - ./data/promtail/log:/var/log
      - ./config/promtail:/etc/promtail
      - ./config/promtail/promtail-config.yaml:/etc/promtail/promtail-config.yaml:ro
      # Windows 環境下的容器日誌路徑
      - /var/run/docker.sock:/var/run/docker.sock:ro
      - //./pipe/docker_engine://./pipe/docker_engine # 修正的 npipe 配置
    command: -config.file=/etc/promtail/promtail-config.yaml
    depends_on:
      - loki
    networks:
      - loki

  grafana:
    image: grafana/grafana:11.4.0
    volumes:
      - ./data/grafana:/var/lib/grafana
      - ./config/grafana/provisioning:/etc/grafana/provisioning  # 添加 provisioning 映射
    environment:
      - GF_PATHS_PROVISIONING=/etc/grafana/provisioning
      - GF_AUTH_ANONYMOUS_ENABLED=true
      - GF_AUTH_ANONYMOUS_ORG_ROLE=Admin
    ports:
      - "3000:3000"
    depends_on:
      - loki
    networks:
      - loki
在 Program.cs 拿掉 .WriteTo.GrafanaLoki,保留 .WriteTo.Console(),這裡我用 CompactJsonFormatter
var formatter = new CompactJsonFormatter();
Log.Logger = new LoggerConfiguration()
    .MinimumLevel.Information()
    .MinimumLevel.Override("Microsoft.AspNetCore", LogEventLevel.Warning)
    .Enrich.FromLogContext()
    .WriteTo.Console(formatter)                                                         // 使用 JSON 格式輸出
    .WriteTo.File(formatter, "logs/aspnet-.txt", rollingInterval: RollingInterval.Hour) //正式環境不要用 File
    .WriteTo.Seq("http://localhost:5341", payloadFormatter: formatter)
    .CreateBootstrapLogger();
Log.Information("Starting web host");
啟動 container
docker compose up -d
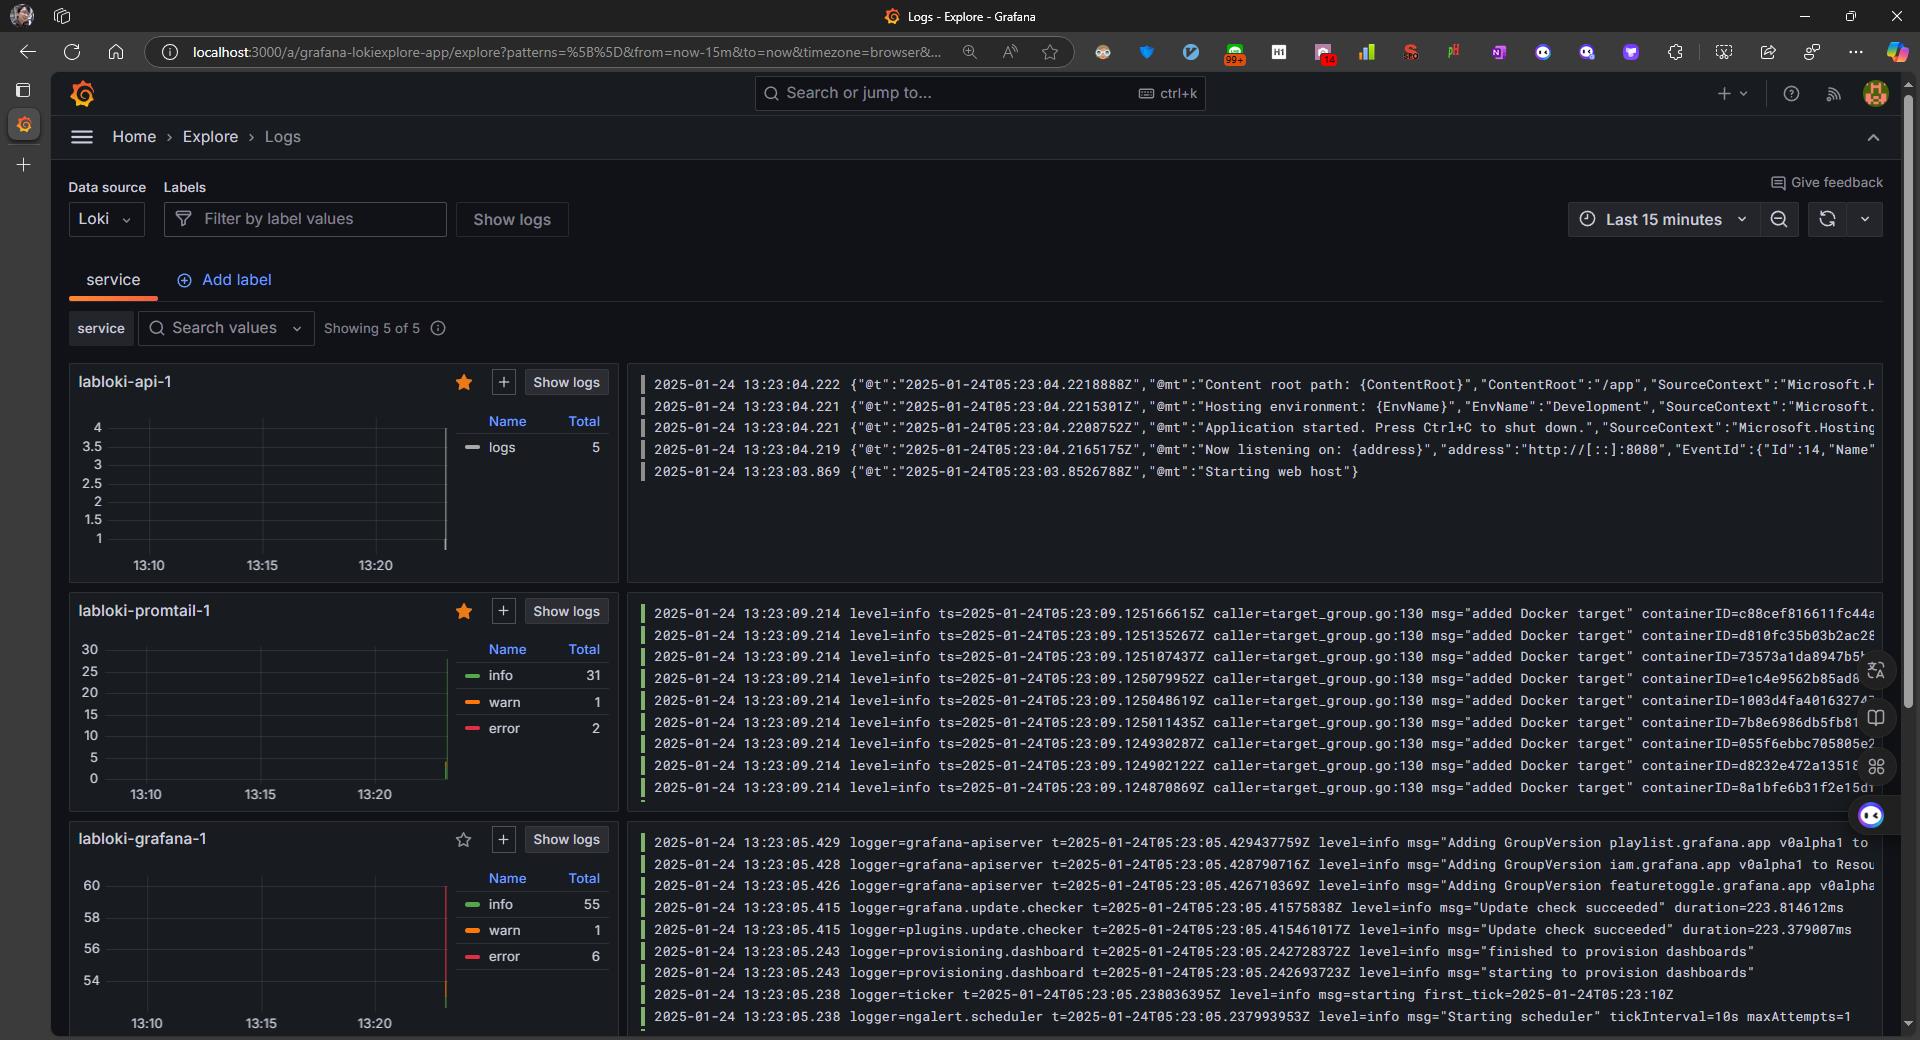
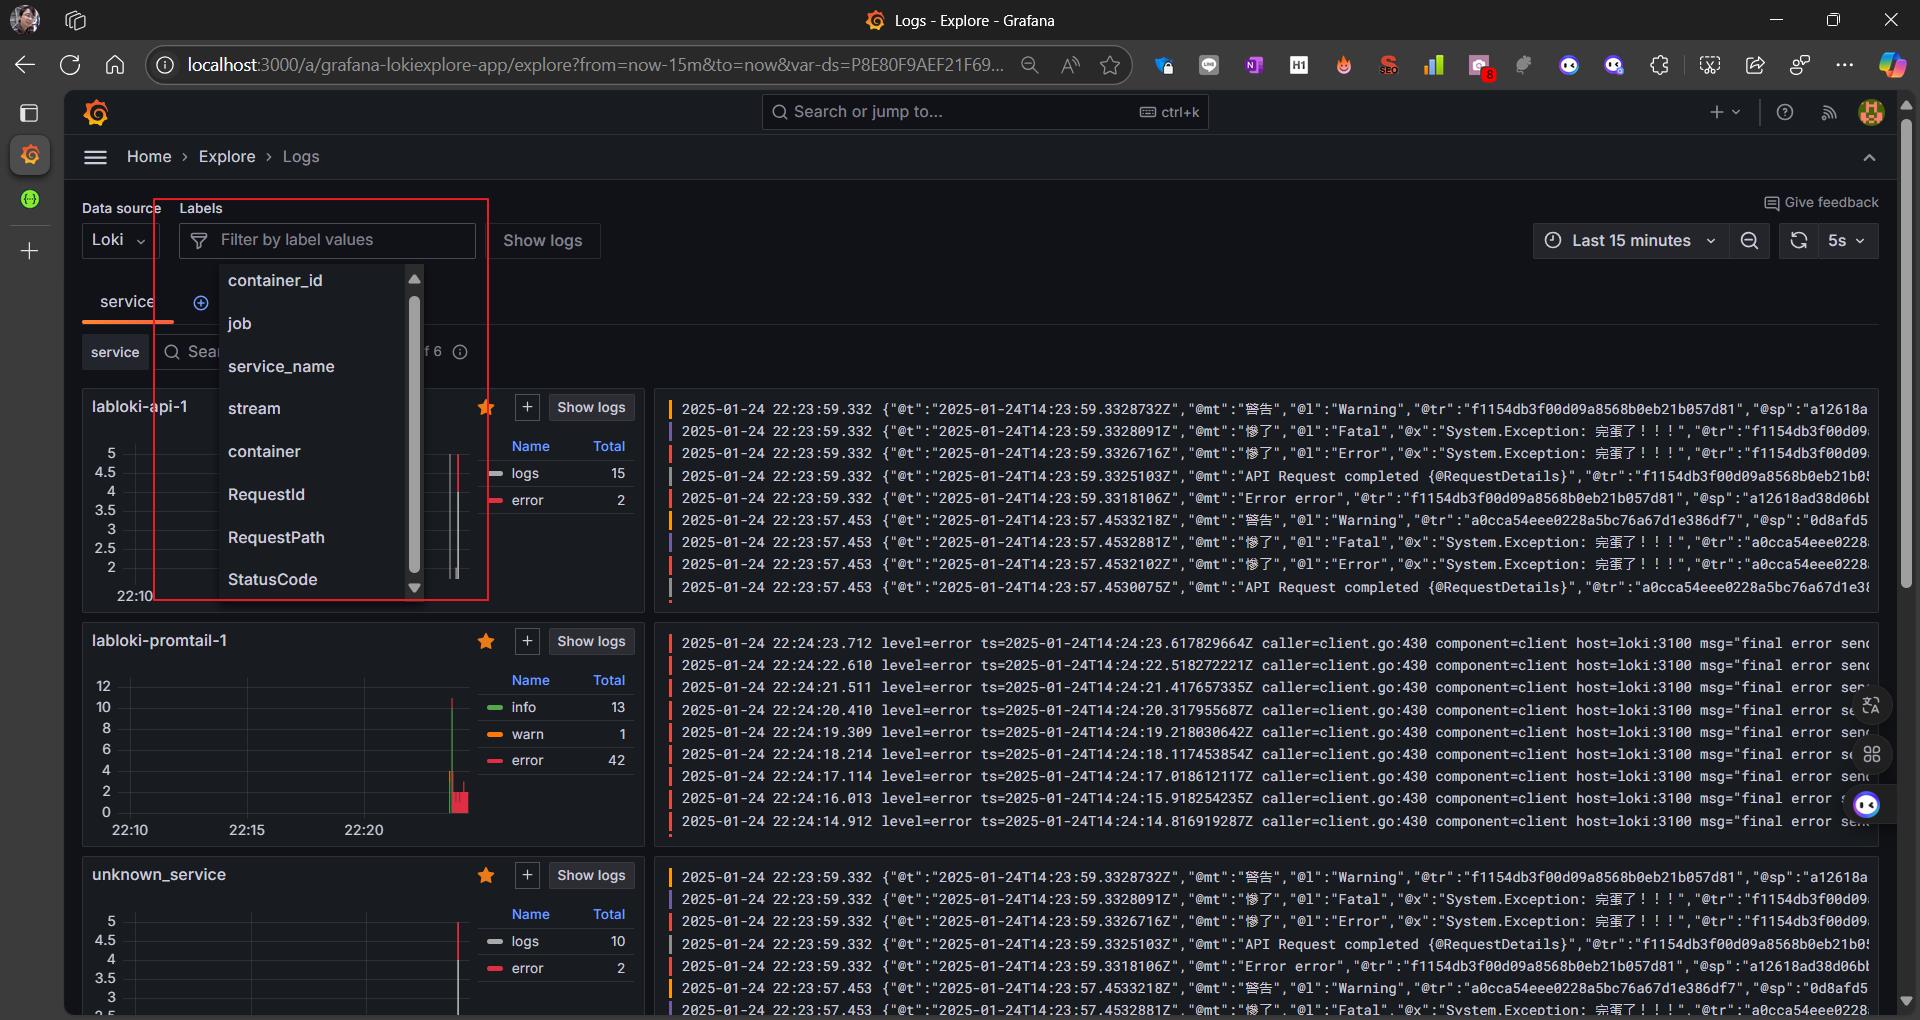
可以觀察到所有的 container 的 log 都被收進來
尻一下 api
curl -X 'GET' `
 'http://localhost:8080/api/v1/members' `
 -H 'accept: */*' `
 -v `
 -i
觀察 label 也如期的被建立
心得
在 promtail 的配置卡了一些時間,只要 log 包含了 error 字串,就會被自動判定 detected_level = error,試了好幾種方法都不知道該怎麼關閉,這訊息有點令人困惑,所幸可以用別的方法忽略。
WriteTo.GrafanaLoki 跟 promtail 都可以將 log 轉換、打標,promtail 不依賴特定語言,只專注在處理 console output 收集 log。
範例位置
sample.dotblog/StructLog/Lab.Loki at master · yaochangyu/sample.dotblog
若有謬誤,煩請告知,新手發帖請多包涵

Microsoft MVP Award 2010~2017 C# 第四季
Microsoft MVP Award 2018~2025 .NET
