MainPage.xmal 的 XAML:
<?xml version="1.0" encoding="utf-8" ?>
<ContentPage
    x:Class="TestLiveCharts.Maui.MainPage"
    xmlns="http://schemas.microsoft.com/dotnet/2021/maui"
    xmlns:x="http://schemas.microsoft.com/winfx/2009/xaml"
    xmlns:lvc="clr-namespace:LiveChartsCore.SkiaSharpView.Maui;assembly=LiveChartsCore.SkiaSharpView.Maui"
    xmlns:vm="clr-namespace:TestLiveCharts.Maui.ViewModels">
    <ContentPage.BindingContext>
        <vm:MainPageViewModel />
    </ContentPage.BindingContext>
    <lvc:CartesianChart
        DrawMarginFrame="{Binding Frame}"
        Series="{Binding Series}"
        TooltipPosition="Hidden"
        XAxes="{Binding XAxes}"
        YAxes="{Binding YAxes}"
        ZoomMode="Both" />
</ContentPage>
MainPageViewModel 當中的 C# 程式:
public ICartesianAxis[] XAxes { get; set; } = [
        new Axis {
            Name = "X axis",
            SeparatorsPaint = new SolidColorPaint(new SKColor(220, 220, 200)),
            MinStep = 0.2,  //與前篇不同處 - 為了手機畫面調整 Y 軸
            ForceStepToMin = true
        }
];

public ICartesianAxis[] YAxes { get; set; } = [
        new Axis {
            Name = "Y axis",
            MaxLimit = 1,   //與前篇不同處 - 為了手機畫面限制 Y 軸
            MinLimit = -1,  //與前篇不同處 - 為了手機畫面限制 Y 軸
            SeparatorsPaint = new SolidColorPaint(new SKColor(200, 200, 200)),
            MinStep = 0.2,  //與前篇不同處 - 為了手機畫面調整 Y 軸
            ForceStepToMin = true
        }
];

public ISeries[] Series { get; set; } = [
	    new LineSeries<ObservablePoint>{
            Values = Fetch(),
            Stroke = new SolidColorPaint(new SKColor(33, 150, 243), 4),
            Fill = null,
            GeometrySize = 0
        }
];

private static List<ObservablePoint> Fetch()
{
        var list = new List<ObservablePoint>();

        var pointCount = 1000;
        var n = 4;

        double[] theta = Enumerable.Range(0, pointCount).Select(o => 2 * Math.PI * o / pointCount).ToArray();
        double[] r = theta.Select((v, i) => Math.Sin(n * v)).ToArray();
        double[] x = r.Select((v, i) => v * Math.Cos(theta[i])).ToArray();
        double[] y = r.Select((v, i) => v * Math.Sin(theta[i])).ToArray();

        for (var i = 0; i < pointCount; i++)
        {
            list.Add(new()
            {
                X = x[i],
                Y = y[i]
	        });
        }

        return list;
}
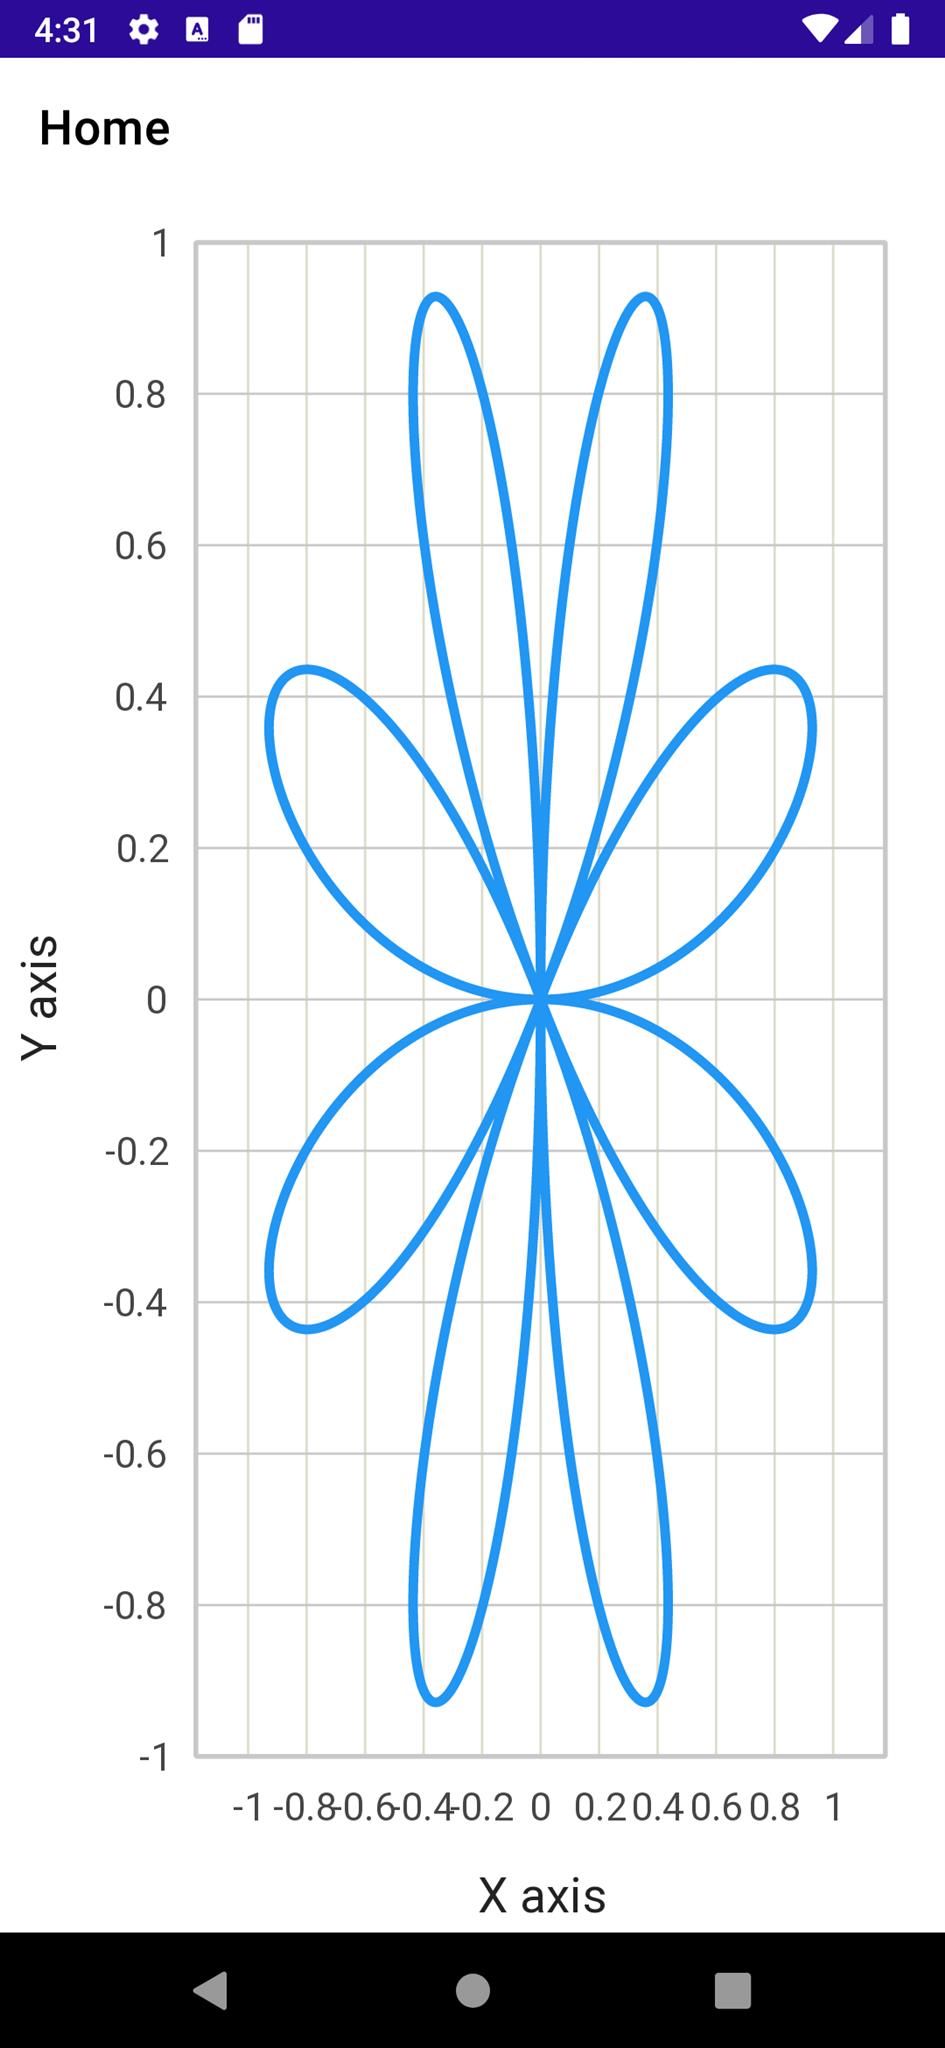
以手持式直立方向觀看畫面時 Y 軸會拉長,玫瑰曲線看起來沒這麼 "正"。但看看上述的 XAML 就知道,如果要的話是可以針對畫面進一步作調整的。

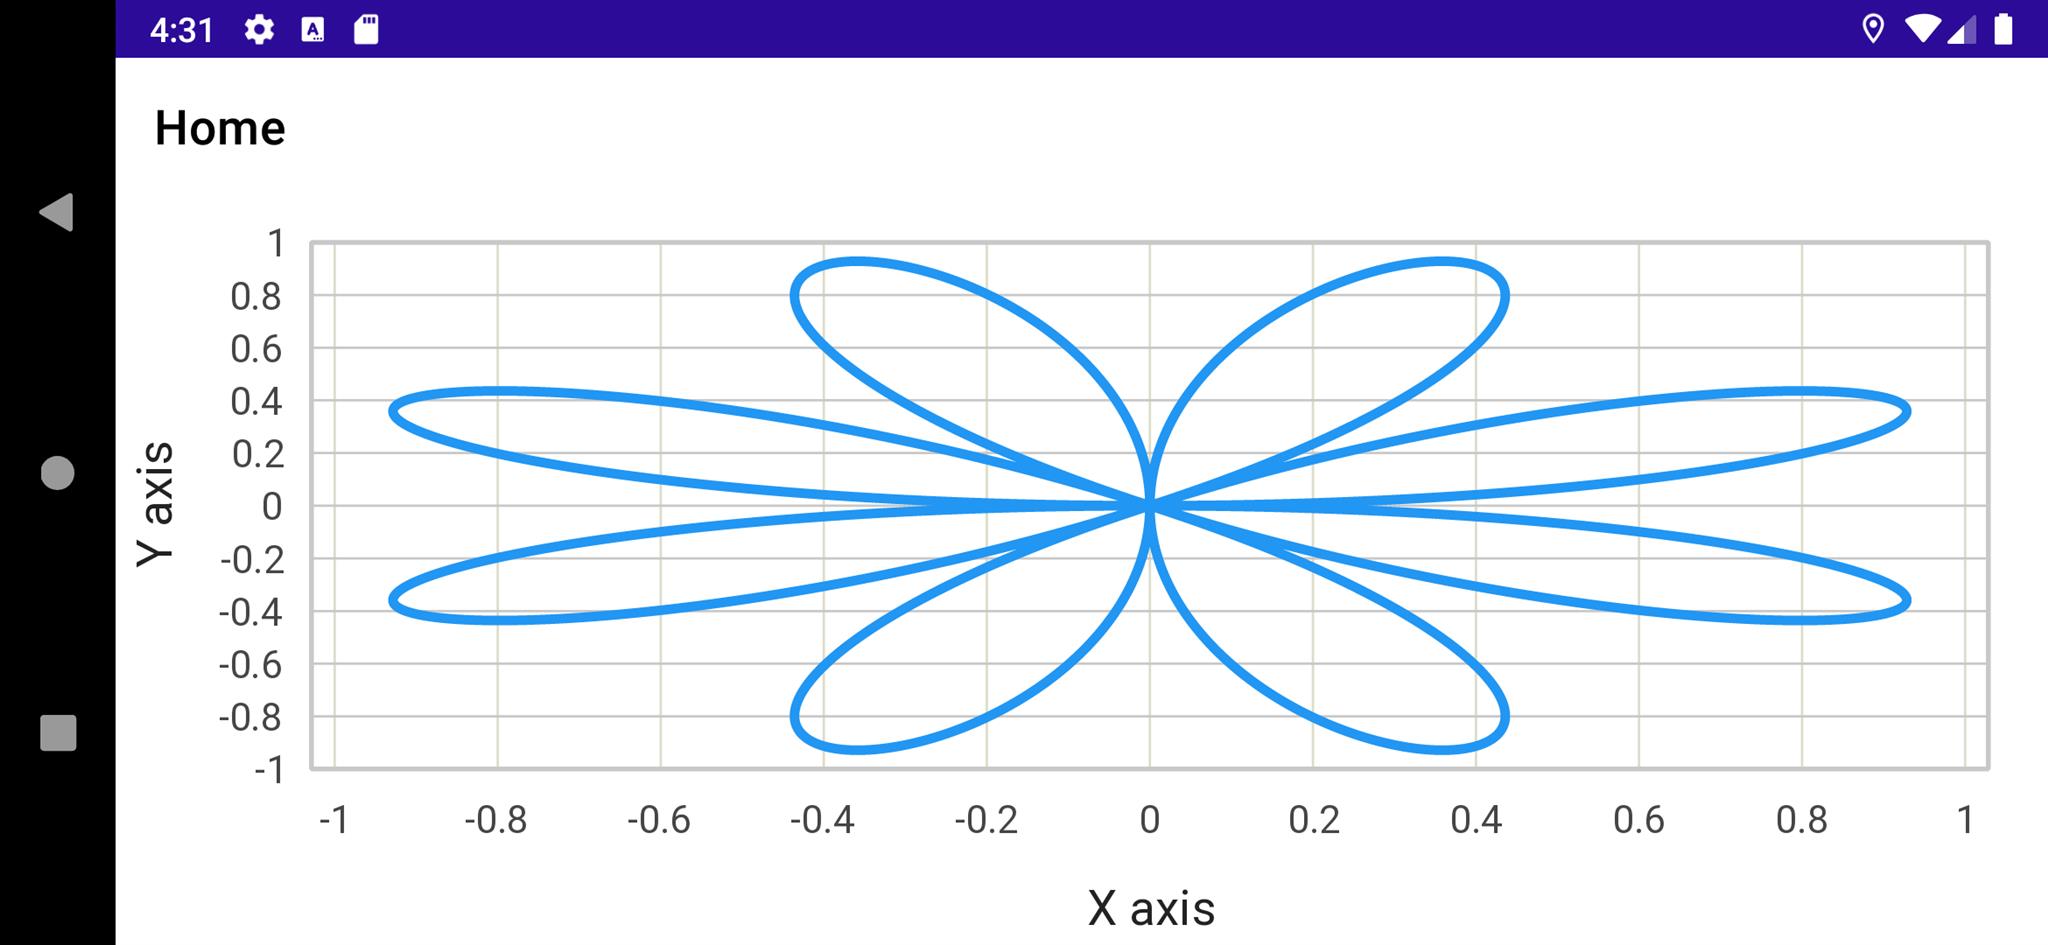
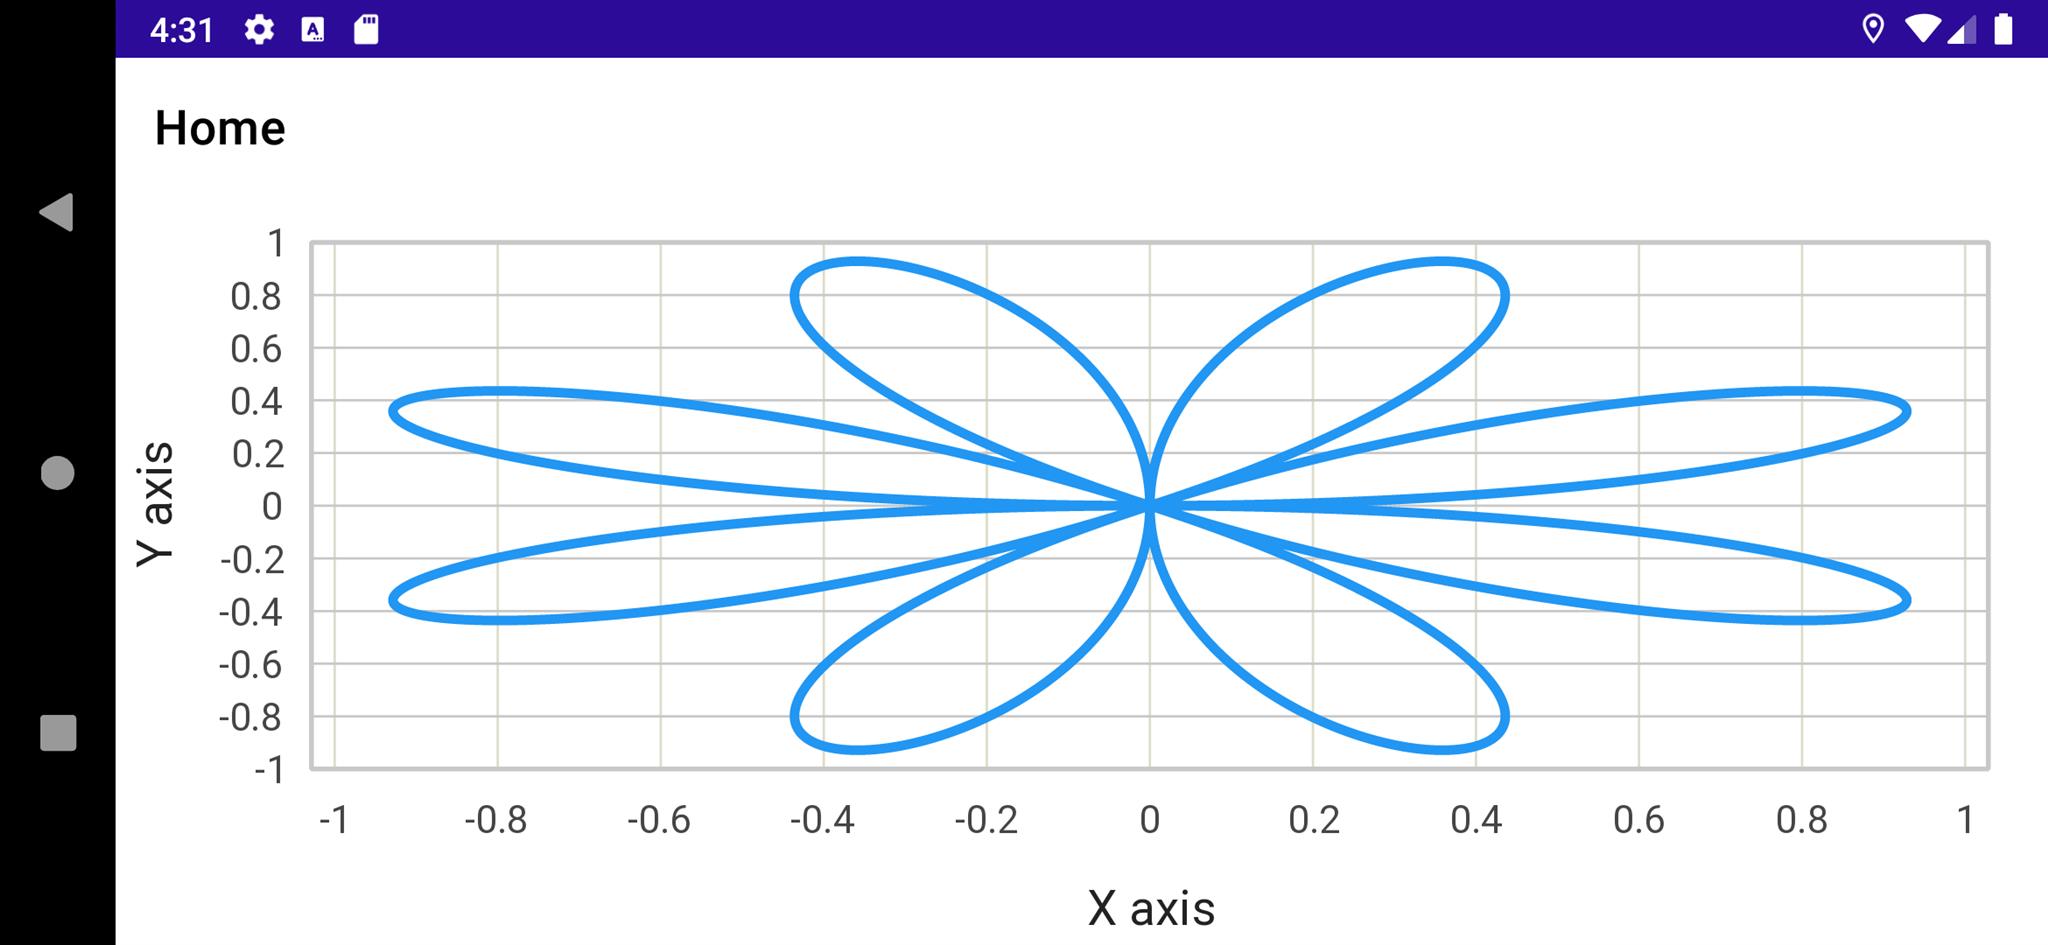
手機使用橫向顯示時看起來的效果:

I'm a Microsoft MVP - Developer Technologies (From 2015 ~).

I focus on the following topics: Xamarin Technology, Azure, Mobile DevOps, and Microsoft EM+S.
If you want to know more about them, welcome to my website:
https://jamestsai.tw
本部落格文章之圖片相關後製處理皆透過 Techsmith 公司 所贊助其授權使用之 "Snagit" 與 "Snagit Editor" 軟體製作。
