SQL Server 也是系統重要的平台之一,有了上一篇的經驗 使用 InfluxDB + Telegraf + Grafana 監視 Windows 平台資源,接下來實作監視 SQL Server
實作環境
- Windows 10
- Telegraf 1.13.4
- Granfana 6.6.2
- InfluDB 1.7.10
- SQL Server 2012 Derver 2012 Develop
開始之前請先看過以下內容
使用 InfluxDB + Telegraf + Grafana 監視 Windows 平台資源
[Grafana] 如何安裝及配置 Grafara Dashboard
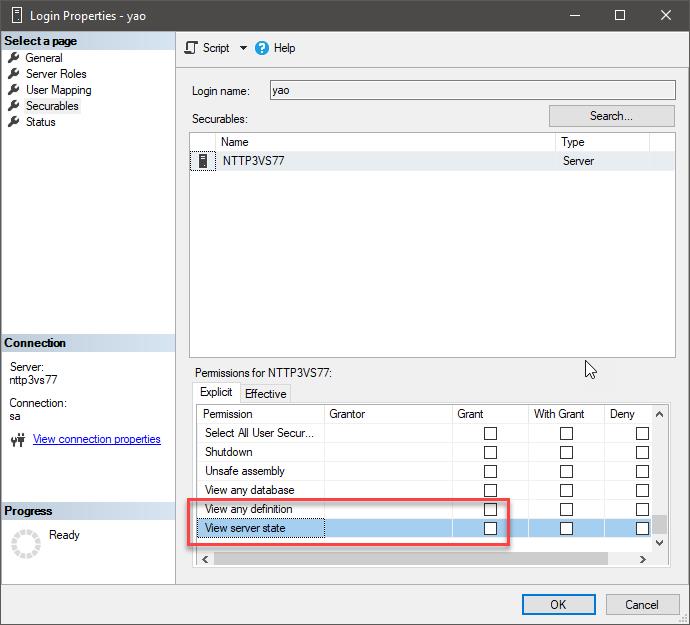
設定 SQL Server 權限
SQL Server 要能收集資料最低要有以下權限
VIEW SERVER STATE、VIEW ANY DEFINITION
腳本如下:
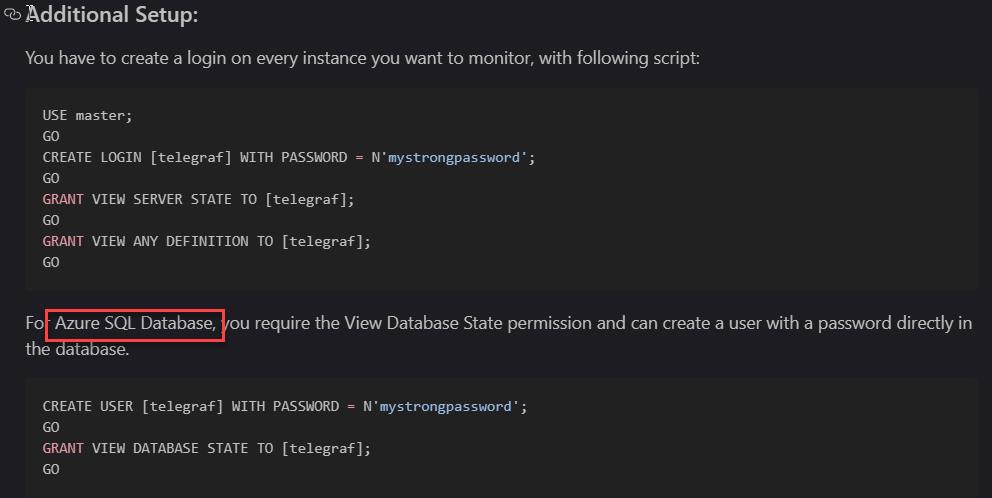
USE master;
GO
CREATE LOGIN [telegraf] WITH PASSWORD = N'mystrongpassword';
GO
GRANT VIEW SERVER STATE TO [telegraf];
GO
GRANT VIEW ANY DEFINITION TO [telegraf];
GO
SSMS 設定畫面如下圖:
Azure SQL Database 的資料庫最低要有以下權限
VIEW SERVER STATE
下圖出自:https://github.com/influxdata/telegraf/blob/release-1.13/plugins/inputs/sqlserver/README.md
Telegraf
Input
收集 SQL Server 需要 inputs.sqlserver plusin,使用 SQL Server 提供的動態管理視圖,記錄的指標是輕量級的。
支援版本:
SQL Server 2008 SP3及更高版本。
[[inputs.sqlserver]]:預設收集目標會使用
位置:localhost
驗證:Windows 驗證
連接埠:1433
Servers:收集目標
複寫預設。
支援多個位置,用逗點隔開。
有斜線的要改用雙斜線 \\。
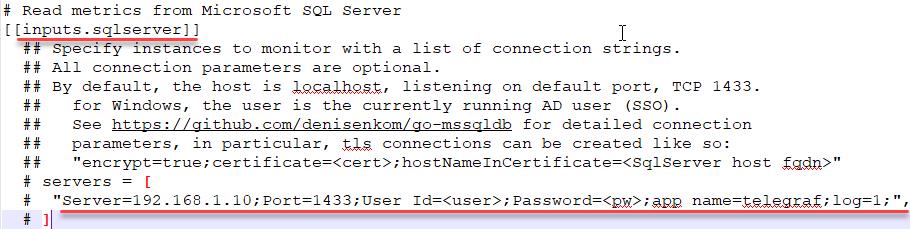
完整設定如下:出自(https://github.com/influxdata/telegraf/blob/release-1.13/plugins/inputs/sqlserver/README.md)
# Read metrics from Microsoft SQL Server
[[inputs.sqlserver]]
  ## Specify instances to monitor with a list of connection strings.
  ## All connection parameters are optional.
  ## By default, the host is localhost, listening on default port, TCP 1433.
  ##   for Windows, the user is the currently running AD user (SSO).
  ##   See https://github.com/denisenkom/go-mssqldb for detailed connection
  ##   parameters, in particular, tls connections can be created like so:
  ##   "encrypt=true;certificate=<cert>;hostNameInCertificate=<SqlServer host fqdn>"
  # servers = [
  #  "Server=192.168.1.10;Port=1433;User Id=<user>;Password=<pw>;app name=telegraf;log=1;",
  # ]

  ## Optional parameter, setting this to 2 will use a new version
  ## of the collection queries that break compatibility with the original
  ## dashboards. All new functionality is under V2
  query_version = 2

  ## If you are using AzureDB, setting this to true will gather resource utilization metrics
  # azuredb = true

  ## If you would like to exclude some of the metrics queries, list them here
  ## Possible choices:
  ## - PerformanceCounters
  ## - WaitStatsCategorized
  ## - DatabaseIO
  ## - DatabaseProperties
  ## - CPUHistory
  ## - DatabaseSize
  ## - DatabaseStats
  ## - MemoryClerk
  ## - VolumeSpace
  ## - Schedulers
  ## - AzureDBResourceStats
  ## - AzureDBResourceGovernance
  ## - SqlRequests
  ## - ServerProperties
  exclude_query = [ 'Schedulers' , 'SqlRequests']
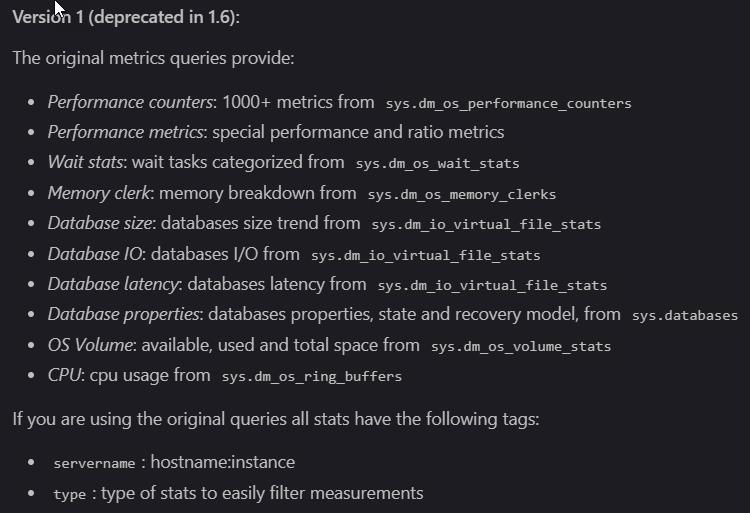
Metrics
收集到的資訊,有哪一些資訊可以用,這些資訊將會用在 Grafana 的 Dashboard
Grafana
匯入 Dashboard
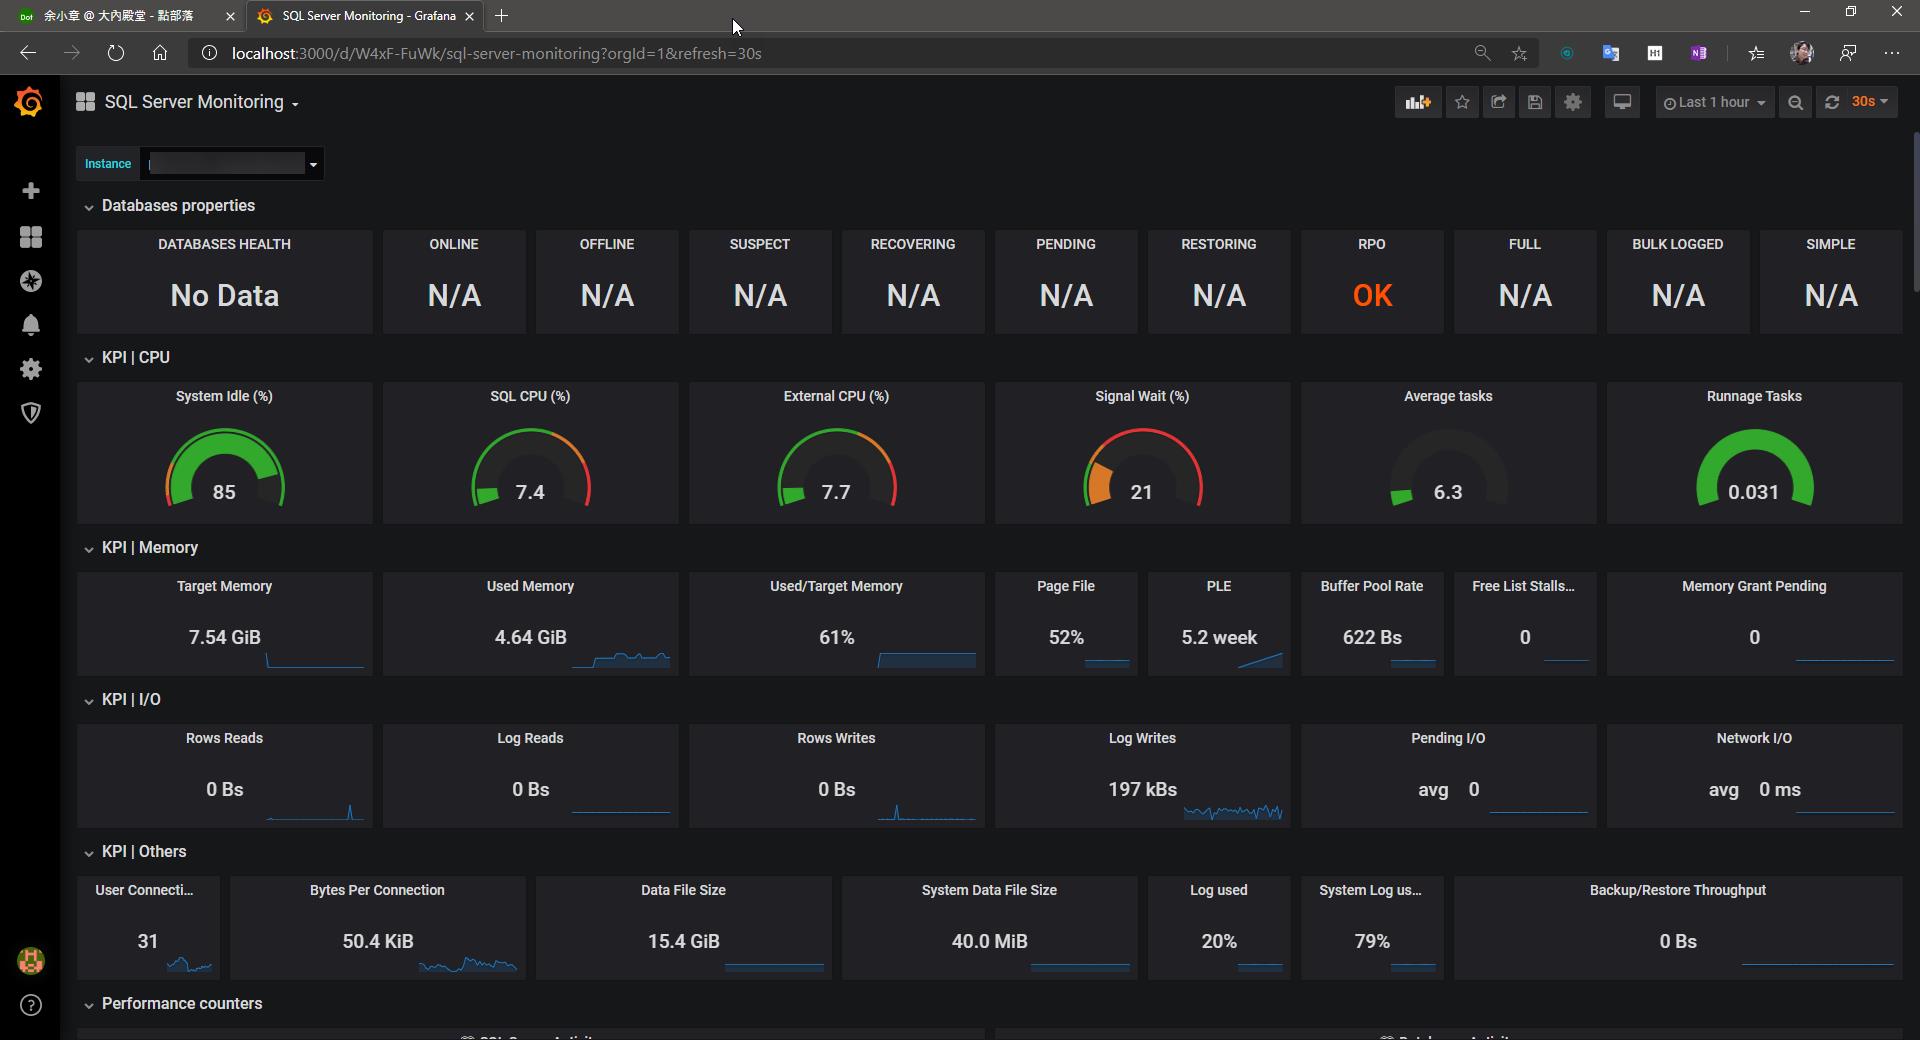
這裡我選用番號 409 (https://grafana.com/grafana/dashboards/409)
能夠做出這個 Dashboard 的人實在是太強大了,執行結果如下圖:
詳細步驟請參考:[Grafana] 如何安裝及配置 Grafara Dashboard
參考
https://grafana.com/grafana/dashboards/409
https://github.com/influxdata/telegraf/blob/release-1.13/plugins/inputs/sqlserver/README.md
若有謬誤,煩請告知,新手發帖請多包涵

Microsoft MVP Award 2010~2017 C# 第四季
Microsoft MVP Award 2018~2022 .NET
