LiveCharts 是一套基於 SkiaSharp 的免費開源圖表套件,早期的版本提供給 UWP、Window Forms 以及 WPF 使用。這邊要介紹的是 v2 版,目前尚在 beta 階段。
v2 支援的框架
依照官網的介紹,目前支援的框架多出不少。
- Cross Platform:MAUI、UNO Platform、Avalonia、ETOFORMS、Xamarin
- Web:Blazor WASM
- Windows : WPF、Windows Forms、UWP、WinUI
安裝
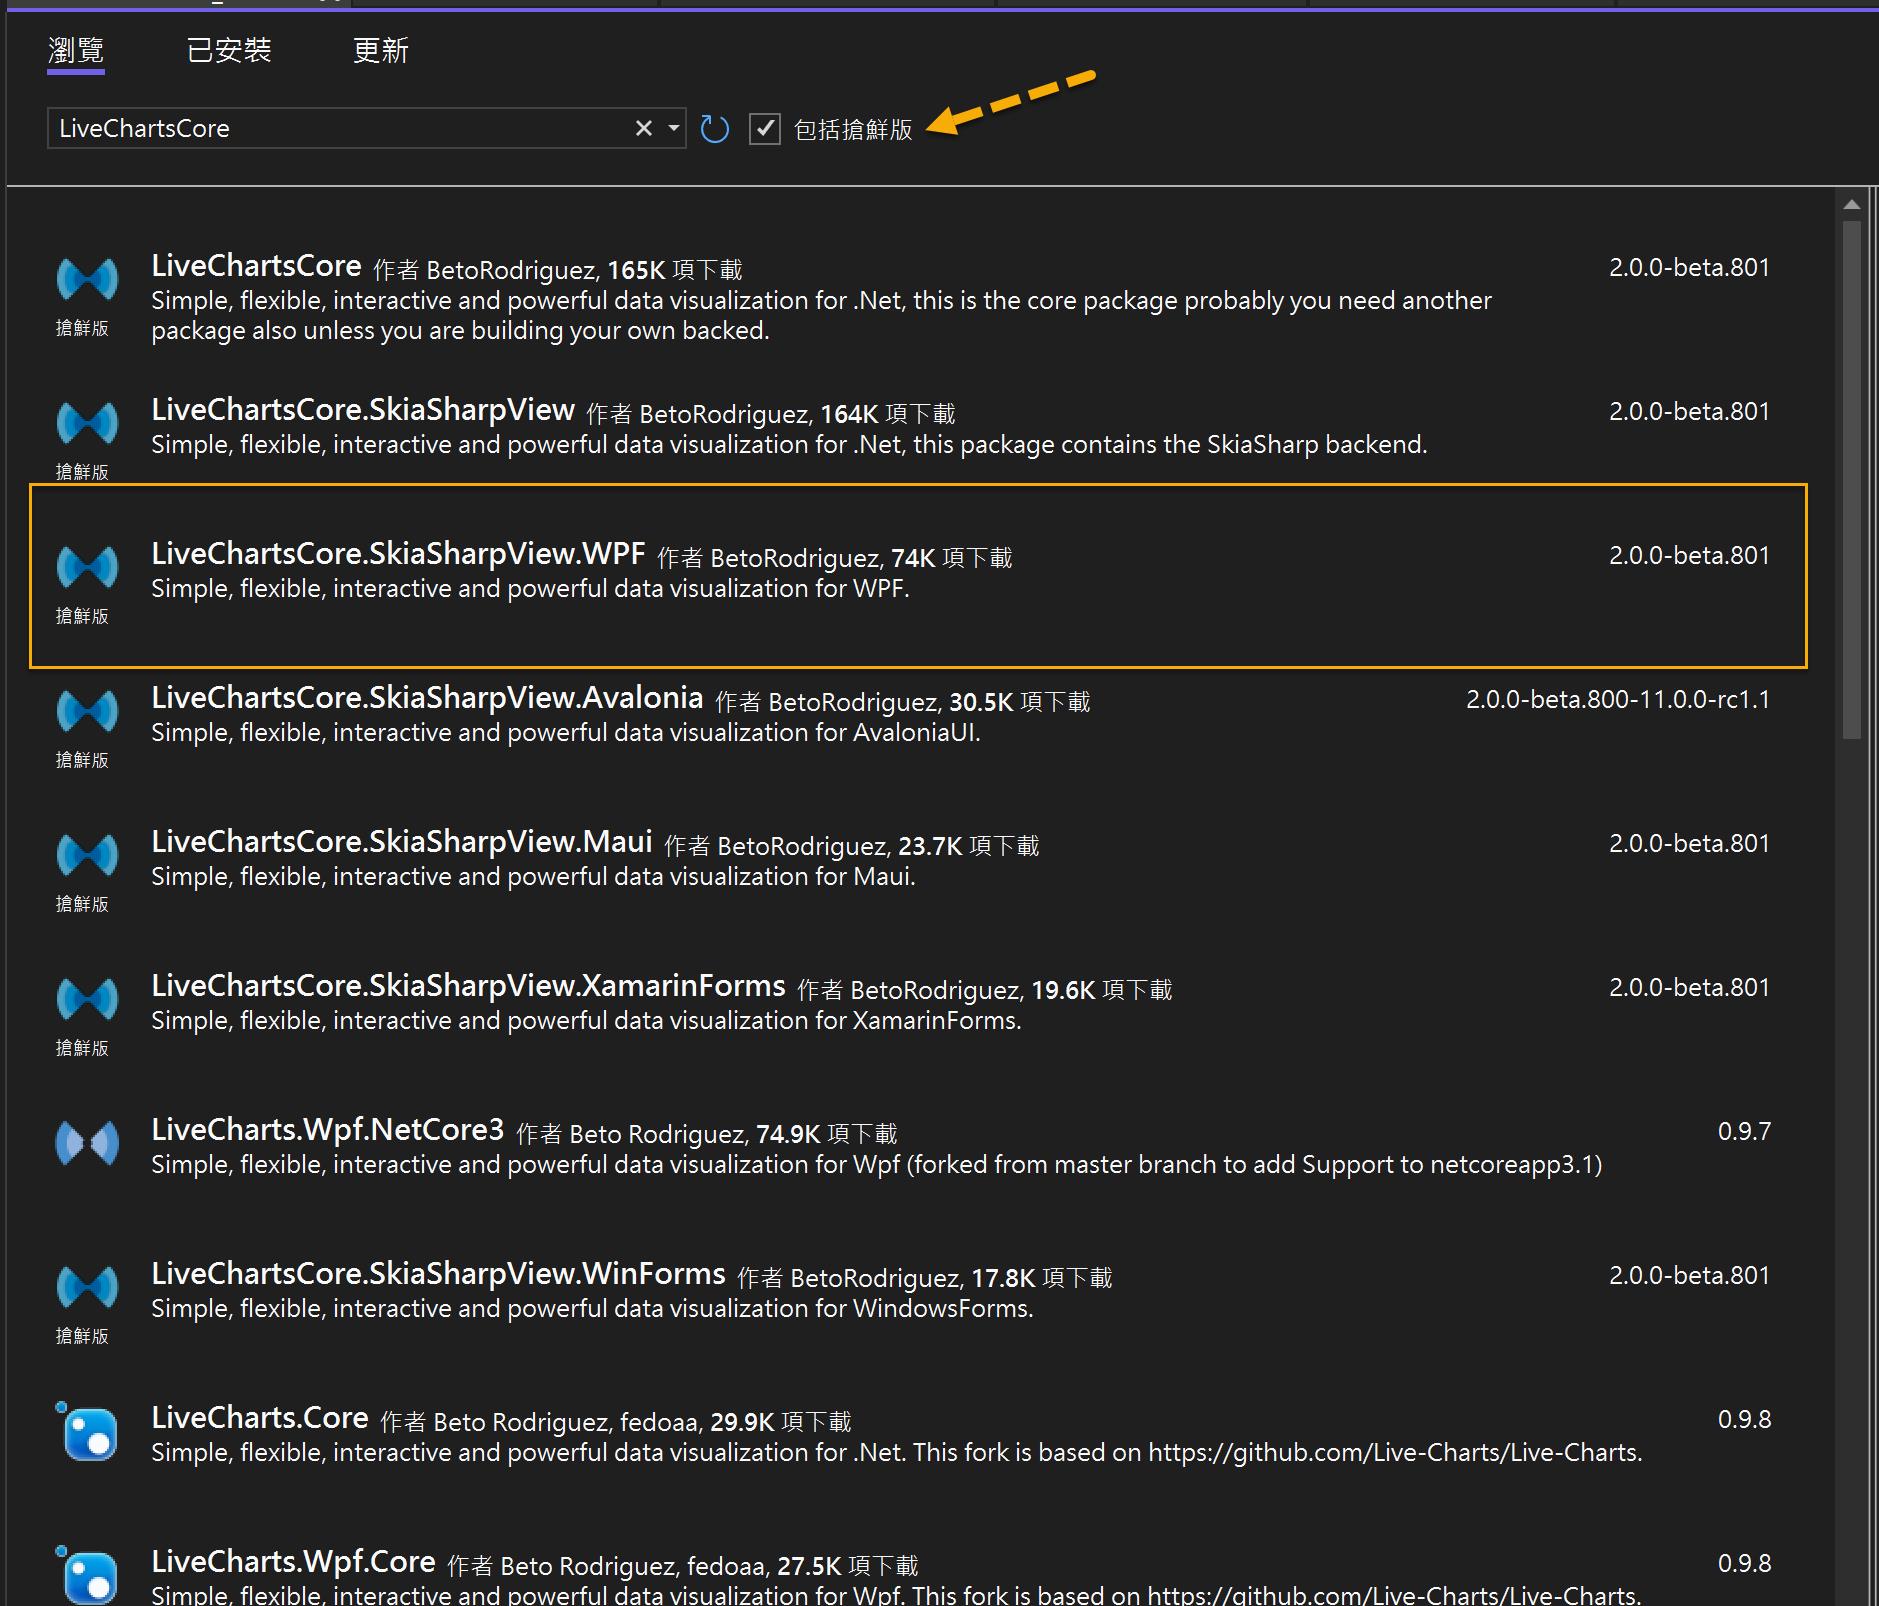
安裝其實很容易,在 nuget 依照你所使用的框架尋找對應套件安裝即可,該有的都會一併裝進來,由於現在還在 beta 階段,所以要勾選「包括搶鮮版」,以 WPF 為例,搜尋框輸入 LiveChartsCore 就可以找得到,如下圖:
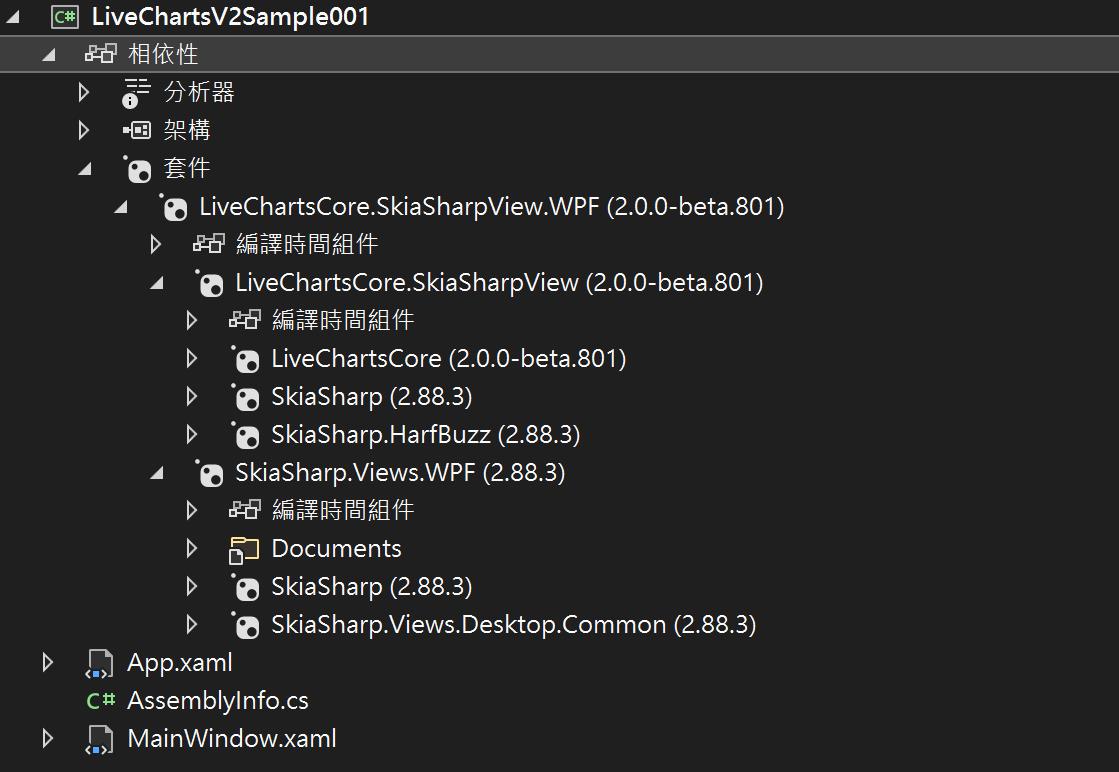
安裝好之後可以看到相依性的部分:
簡單試驗一下
先加入一個簡單的 View Model (因為很懶,就用亂數排序隨便弄出一些數字):
public class MainViewModel : NotifyPropertyBase
{
    private ObservableCollection<ISeries> _series;

    public ObservableCollection<ISeries> Series
    {
        get => _series;
        set => SetProperty(ref _series, value);
    }

    public MainViewModel()
    {
        // LiveChartsCore.SkiaSharpView.LineSeries

        var items = Enumerable.Repeat(Enumerable.Range(0, 50).OrderBy(d => Guid.NewGuid()), 2).SelectMany(x => x).ToArray();

        Series = new ObservableCollection<ISeries>()
        {
            new LineSeries<int>
            {
                Values = items,
                Fill = null
            },

        };

    }
}
上方使用的 ISeries interface 和 LineSeries class 皆來自於套件,簡單說分布在圖表上的點被稱為 Series,LineSeries 就是折線圖的點定義;這些容我以後再一一介紹。
接著是 xaml 的部分,首先要注意的當然是 xmlns 宣告,官方建議這麼用
xmlns:lvc="clr-namespace:LiveChartsCore.SkiaSharpView.WPF;assembly=LiveChartsCore.SkiaSharpView.WPF"
簡單的撰寫圖表方面的 xaml:
<Window x:Class="LiveChart_002.MainWindow"
        xmlns="http://schemas.microsoft.com/winfx/2006/xaml/presentation"
        xmlns:x="http://schemas.microsoft.com/winfx/2006/xaml"
        xmlns:d="http://schemas.microsoft.com/expression/blend/2008"
        xmlns:mc="http://schemas.openxmlformats.org/markup-compatibility/2006"
        xmlns:local="clr-namespace:LiveChart_002"
        xmlns:lvc="clr-namespace:LiveChartsCore.SkiaSharpView.WPF;assembly=LiveChartsCore.SkiaSharpView.WPF"
        mc:Ignorable="d"
        Title="MainWindow" Height="450" Width="800">
    <Window.DataContext>
        <local:MainViewModel/>
    </Window.DataContext>
    <Grid>
        <lvc:CartesianChart Series="{Binding Series}"/>
    </Grid>
</Window>
執行結果
註:本系列文的範例使用 Visual Studio 2022 與 .NET 7。存放在此。